Homeowners Insurance
Bankrate's insurance experts guide you through the basics of homeowners insurance. Our exclusive approach can help you feel more confident in your insurance decisions.
Compare home insurance rates
Answer a few questions to see personalized rates from top carriers.
Powered by Coverage.com (NPN: 19966249)
Coverage.com, LLC is a licensed insurance producer (NPN: 19966249). Coverage.com services are only available in states where it is licensed. Coverage.com may not offer insurance coverage in all states or scenarios. All insurance products are governed by the terms in the applicable insurance policy, and all related decisions (such as approval for coverage, premiums, commissions and fees) and policy obligations are the sole responsibility of the underwriting insurer. The information on this site does not modify any insurance policy terms in any way.
Insuring your home

Determine how much insurance you need
Getting the proper amount of coverage when you choose a homeowner's policy can help prevent insurance hassles later.

Compare home insurance companies
Get a feel for your options so you how know how to choose the best carrier for your home.

Get customized quotes for your home
Find out exactly what you can expect by getting accurate insurance quotes from top carriers.

Explore coverage add-ons
Home insurance policies may not cover everything, like floods or home-based businesses. Check out this list for common exclusions you should be aware of

Purchase your home insurance
Once all the prep work is done, it's time to finalize your homeowners insurance and get that peace of mind. Here's how to make it happen.
Home Insurance Reviews

Review our top home insurance picks of 2025
Our internal banking experts evaluated hundreds of popular financial institutions, using a robust methodology to find this year's best banking experiences, rates and offers.
Reviews from top homeowners insurance providers

Home Insurance Basics

How to switch home insurance companies

How to read a homeowners insurance policy

Factors that impact your cost of homeowners insurance

How much homeowners insurance do I need?

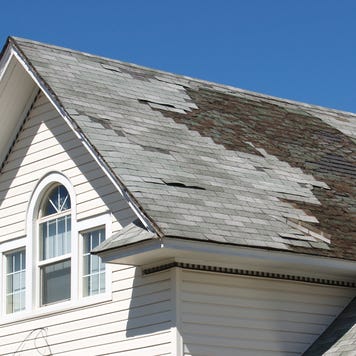
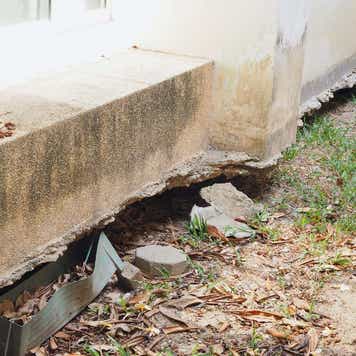
What does homeowners insurance cover?
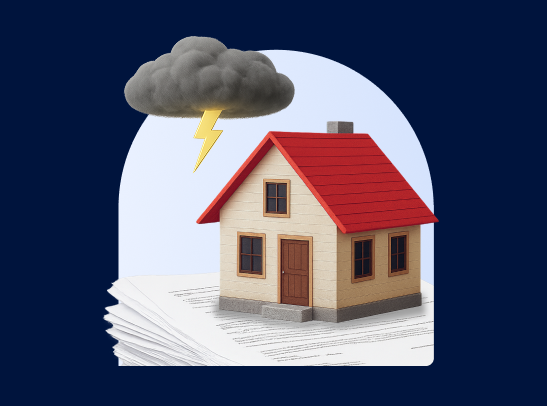

Weather related home insurance coverages to consider

How to protect your home from wildfire

Does homeowners insurance cover hurricane damage?

Windstorm insurance: how it works and who needs it
Latest Articles