Bankrate's Latest News
Get the latest financial news, original data reporting and expert analysis of personal finance trends and hot topics from our award-winning editorial team.
Explore more
Financial News Topics
The Federal Reserve’s decisions have ripple effects, including for mortgages.

HELOC rates dipped, while home equity loan rates hit their highest level of the year.

Mortgage rates rose this week along with inflation, remaining above 6.5%.
Mortgage rates rose this week along with inflation, remaining above 6.5%.
HELOC rates dipped, while home equity loan rates hit their highest level of the year.
Mortgage rates retreated a bit this week but remain above 6.5%.
Mortgage rates retreated a bit this week but remain above 6.5%.
Mortgage rates continue to rise, jumping 14 basis points to 6.6% this week.

Bankrate analyzed the Fed’s historic rate moves for clues on what might come next.

Experian’s new savings account has a yield based on membership tier and no minimum deposit.

A majority (81%) of Americans did not increase their emergency savings this year
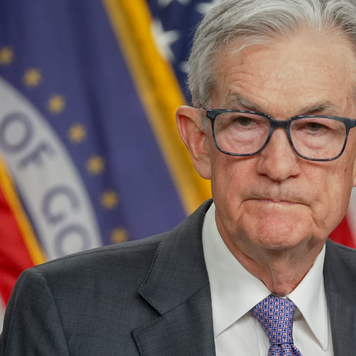
The big question: How long will the Fed be on hold?
Every financial decision you make is impacted by the Federal Reserve.
A complicated U.S. economy. Stubborn inflation and a jobless boom. Unprecedented conflict with the president. Personnel changes, and a new Fed chair. Federal Reserve officials are no stranger to difficult [...]
Expect yields to continue trending downward in 2026.
You can find a CD account that significantly out-earns the national average if you shop around among banks.
The Federal Reserve’s decisions have ripple effects, including for mortgages.
Mortgage rates rose this week along with inflation, remaining above 6.5%.
Mortgage rates rose this week along with inflation, remaining above 6.5%.
Mortgage rates retreated a bit this week but remain above 6.5%.
Mortgage rates retreated a bit this week but remain above 6.5%.
Mortgage rates continue to rise, jumping 14 basis points to 6.6% this week.
Mortgage rates jumped again this week on rising inflation and the ongoing war in Iran.
Mortgage rates jumped again this week as the war in Iran disrupts markets.

View current credit card rates based on Bankrate.com’s weekly national survey of large banks and thrifts.

Here’s how to get more out of your credit card while traveling.

Your credit card might not work in a foreign country. Here are some tips when traveling.

A credit card can be a good financial tool. When should you get one?

Regardless of the amount, spending beyond your credit limit is generally a bad idea.

Those who apply for a Southwest card for a limited time can earn a Companion Pass by meeting the welcome bonus requirement.

American credit card balances rose to $1.13 trillion in the last quarter of 2023

Learn more about the card’s fees, features and more.

Access to credit is tightening — here’s what it means for you.

The Federal Reserve held rates steady at its January 2026 meeting.

Auto rates will likely not decrease this year. Consider how to still save.

Marklyn Johnson drove to the grocery store in March 2025 with her boyfriend and 5-month-old son. They needed groceries, and welcomed a warm indoor diversion on a cold Connecticut winter day. As they [...]

This is a story about a predatory loan that can ensnare you in a matter of hours and lead to crushing debt — and perhaps wrecked credit — that can span years. It’s also a story about how it’s all [...]

In 2025, rates remain high amid economic uncertainty.
Here’s what’s driving the rise in missed payments and what this says about the financial health of U.S. consumers and the road ahead for the economy.

Since you likely didn’t have a federal student loan payment due for about five years, it’s understandable that your on-ramp to repayment might not have been a straight shot. You’d even be forgiven [...]
The trusted provider of accurate rates and financial information