Does homeowners insurance cover wildfire damage?


Key takeaways
- Homeowners insurance typically covers wildfire damage, but carriers may limit coverage in areas with high wildfire risk.
- Fair Access to Insurance Requirements (FAIR) plans are state-sponsored insurance options that may help homeowners secure coverage if they live in high-risk areas.
- Creating defensible space, ensuring water access on your property and considering fire risk when landscaping or renovating are all ways to potentially reduce your home’s wildfire risk.
- California, Colorado and Texas have the highest number of properties at extreme risk for wildfire damage.
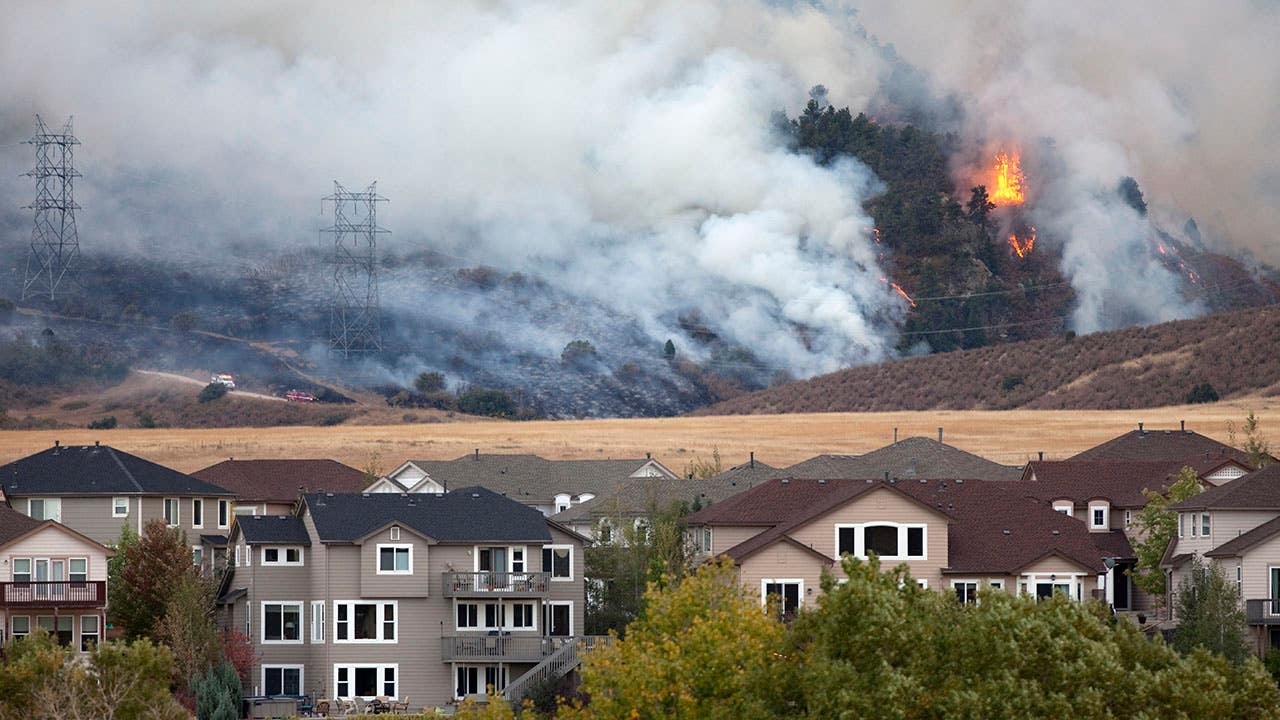
Prolonged droughts and earlier snowmelt have stretched the fire season from four months to as many as eight, increasing wildfire risk in areas that once rarely saw flames, according to a recent Moody’s report. As of March 2025, the U.S. has already experienced more than 7,100 wildfires, a roughly 37 percent increase for the same period over a 10-year average.
With a greater and more widespread risk of wildfires across the country, it’s important to know if your home insurance does cover forest fires and how wildfire insurance works.
Does home insurance cover wildfires?
Homeowners insurance policies usually cover damage caused by fires, including wildfires. Regardless of the type of homeowners policy you have, damage caused by fire is almost always covered. That said, some carriers may limit or stop writing coverage in states and regions that are prone to wildfire damage. For example, seven of California’s 12 largest home insurance companies have either paused or greatly limited writing new home insurance policies in the state, in part because of the higher wildfire risk.
Wildfire-related claims can be extraordinarily expensive for insurers to pay out. Economic and damage losses from the 2025 Los Angeles fires alone are estimated to be between $250 billion and $275 billion, with insurance losses around $25 billion to $45 billion. If too many carriers are unwilling to take on the risk, homeowners in high-risk fire zones may struggle to find a policy from a private insurance company.
What is included in home insurance protection for wildfires?
Home insurance does cover wildfires, as long as your policy doesn’t have a specific exclusion. Coverage usually extends beyond the dwelling coverage for the structure of your home to include:
- Detached structures: A structure that isn’t permanently attached to your home is considered a detached structure, such as a fence, shed, garage, swimming pool or gazebo. The other structures portion of your home policy usually covers up to 10 percent of the dwelling coverage for detached structures. For example, if your home is insured for $400,000, detached structures may be covered for up to $40,000. You can usually increase this limit if needed.
- Personal belongings: Homeowners insurance typically includes personal property coverage, which helps replace items like furniture, electronics, clothing and appliances lost in a wildfire. Your home policy doesn’t cover your vehicle — you’d need comprehensive coverage on your car insurance for wildfire coverage.
- Additional living expenses: Also called loss of use, additional living expenses coverage can help cover costs you incur if a wildfire forces you to evacuate or your home becomes uninhabitable from a fire. Covered expenses may include pet boarding, laundry services, hotel stays, temporary rentals and extra food costs.
When does homeowners insurance not cover wildfire damage?
Homeowners in areas of the U.S. with a higher risk of wildfire damage may find it more difficult to get coverage for wildfire damage or homeowners coverage in general. Homeowners insurance companies may exclude wildfire damage on a standard insurance policy or be unwilling to write coverage at all in these high-fire-risk areas.
If that is the case where you live, you may need to pursue a state-run insurance option. Fair Access to Insurance Requirements plans, or FAIR plans, are offered by 33 states and Washington, D.C. and may help homeowners in high-risk areas get coverage if they have been denied coverage by private carriers. Although California and Oregon offer state and taxpayer-sponsored FAIR plans, some other states with high wildfire risk, like Nevada and Arizona, do not.
Of the 2.6 million U.S. homes at extreme risk from wildfires, more than 1.2 million are located in California. As wildfires become more frequent and severe in the state, some carriers are unwilling to take on the risk of insuring California homes. Since late 2022, more than half of the 12 largest home insurance companies in California have either completely paused or placed serious restrictions on writing new policies in the state. These companies include State Farm, Allstate, Farmers, USAA, Travelers, Nationwide and Chubb. Most companies cited heightened wildfire risk as a major reason for scaling back.
State Farm, the first of the bunch to make waves for pausing new policies in California, made headlines again recently for walking back a previous announcement that it would nonrenew around 30,000 home policies. Now, the company states that it will honor those insurance contracts, but fire will no longer be a covered peril. In order to get wildfire protection, State Farm policyholders in California would need to turn to the FAIR Plan — which is already strained and extremely expensive. Specifically, State Farm policyholders with renewal dates after July 3, 2024, will need to purchase a FAIR Plan coverage.
The insurer is in danger of financial collapse after a $7.9 billion loss from the Los Angeles fires, $300 million higher than initial estimates. The California Insurance Commission recently approved a 17 percent rate increase for home insurance customers and 15 percent for renters insurance to alleviate some of its financial strain and stem the tide of cancellations and nonrenewals.
How to prevent home damage from wildfires
Finding homeowners insurance may be the best course of action to financially protect your home from wildfire damage, but reducing your home’s fire exposure may prevent damage in the first place. The following steps may help you avoid wildfire damage to your home and may even earn you a mitigation discount with some carriers. The following steps may help reduce your home’s wildfire risk:
- Create defensible space: Clearing away flammable materials from the perimeter of your home may prevent wildfire flames from reaching your home’s structure. This may include removing vegetation and debris from around your home and regularly clearing out dead vegetation from your property to eliminate wildfire fuel.
- Ensure water access on your property: Placing visible hoses at regular intervals around your property may help firefighters quickly access water to defend your property and extinguish embers in the event of a wildfire.
- Clearly mark your address: It may seem trivial, but ensuring that firefighters can clearly see your marked address from your road may help them more quickly identify structures to defend in the event of a wildfire.
- Consider fire risk when landscaping or renovating: Certain construction and landscaping materials are far more fire-resistant than others. If you live in a high-risk wildfire area, opting for concrete and stone over wood may help reduce your burn risk. Fire-resistant roofs may also prevent embers from igniting your home. Planting native and drought-resistant plants, as well as employing landscaped firebreaks, may also help reduce your yard’s exposure to fire damage.
Frequently asked questions
Why we ask for feedback Your feedback helps us improve our content and services. It takes less than a minute to complete.
Your responses are anonymous and will only be used for improving our website.

You may also like

Does homeowners insurance cover wood stoves?
Does homeowners insurance cover roof leaks?

Does homeowners insurance cover volcanic eruptions?
Does homeowners insurance cover fire damage?