The unemployment rate, explained – and why the coronavirus crisis has caused it to skyrocket

If there’s anything you have in common with an economist, it’s that you both care how many people in the U.S. have a job.
A high unemployment rate means times are tough across the country. For Americans, it means firms may be closing and hiring has likely diminished. From an economist’s perspective, it means the financial system isn’t as productive as it could be and that Americans might soon tap the brakes on spending – the consumer-driven economy’s main source of growth.
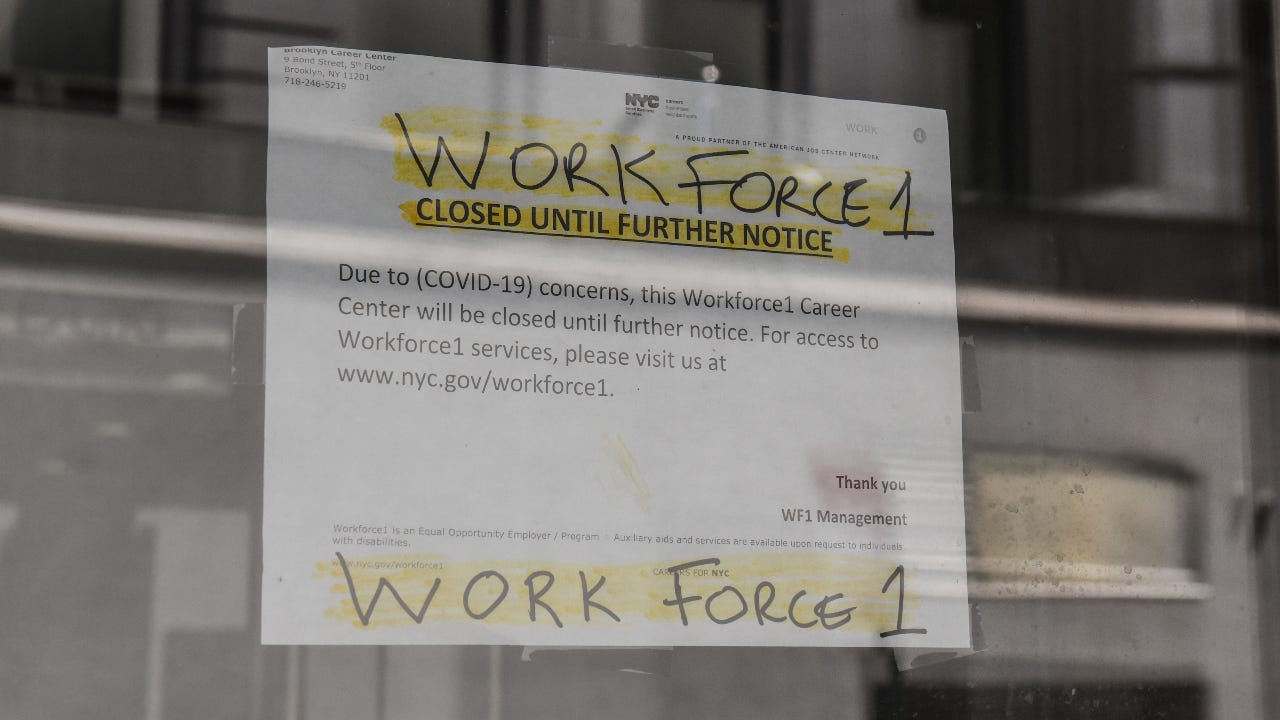
Joblessness has surged in the face of the coronavirus pandemic, skyrocketing to catastrophic levels that experts haven’t seen for nearly a century. More than 33 million Americans have applied for unemployment benefits since President Donald Trump declared a state of emergency on March 13. That’s about one in five U.S. workers. The official unemployment rate surged to 14.7 percent in April, according to the monthly employment report from the Department of Labor.
“Should we be opening the economy or not, or what the long-run effects of the shutdown might be – those discussions are going to hinge critically on how many people are out of work, how many people’s hours have been cut, whether those jobs have come back,” says Adam Blandin, assistant economics professor at Virginia Commonwealth University.
But how unemployment is calculated is tricky, and it requires hours of research, quality control and fact-checking for every economist and data collector involved. It also has the power to influence policymakers at the Federal Reserve to cut or raise interest rates. Many experts, however, have warned that there are limitations to how much you can learn from the headline unemployment rate – and it might not tell the full story of how much the coronavirus pandemic has choked off job growth.
Here’s what you need to know.
What is the unemployment rate, and how is it calculated?
The unemployment rate is just as it sounds: It’s the percentage of the labor force that doesn’t have a job. It’s compiled in a monthly report from the Department of Labor at the Bureau of Labor Statistics (BLS), typically released on the first Friday of every month.
Data goes back all the way to the 1940s.
But it’s important to note that the size of the labor force isn’t the same as the entire U.S. population. The labor force is made up of working age individuals (age 16 and up) who are employed and unemployed.
At the same time, not all people who are jobless are counted as unemployed. You have to be actively seeking work and available to take a job if it’s offered to you.
From a qualification standpoint, “active” job search means searching for a position sometime within the last four weeks. It can be anything from having a job interview, sending an application or contacting relatives and friends about open positions. Other methods, such as reading about job openings or attending a job training program – what the BLS deems “passive” research – do not count.
The unemployment rate will never fall to zero, just because there are always individuals switching jobs, new people entering the labor force or individuals who’ve been phased out due to technological changes. There is, however, a level that economists call “full employment,” a point where everyone who wants a job can find one.
How is the data put together?
Compiling the report is a massive undertaking.
Technically speaking, two surveys feed into the broader monthly employment report: the establishment survey and the household survey. The establishment survey polls businesses across every industry in the economy to calculate how many positions they’ve added or taken away from their payrolls in a given month. The household survey, on the other hand, is where unemployment rate calculations come in.
Data collectors at the Census Bureau have been in charge of compiling the data for this survey since 1942. About 60,000 households participate in the survey, totaling about 110,000 individuals, according to the Department of Labor.
Households are interviewed for four straight months, then they’re set aside for eight months, and then interviewed again for another four months. It gives economists a proper control group, allowing experts to make broader assessments of how the labor market has changed, according to Karen Kosanovich, a labor economist at the BLS who works on the side of the jobs report that compiles the unemployment rate. She estimates that her team of around a dozen economists and a handful of supervisors have “essentially three or four days to create the report,” she says.
Given that the report is full of market-moving and sensitive information, security procedures start even before the data is collected, she says. Survey respondents’ information is kept confidential – and Kosanovich has made an oath to protect the data for the rest of her life.
“When you’re in production for the employment situation news release, my colleagues can’t come in and visit me at my desk,” Kosanovich says. “In fact, the janitor can’t come in to empty my trash can for a certain number of days. You have to carry your trash to a bin in the hallway. If a minor light goes out, it will have to wait to be replaced outside of the production period.”
What are the different ways of measuring unemployment, and when should you use them instead?
But there’s a caveat to the unemployment rate: “No single number can capture a labor market as complex and dynamic,” Kosanovich says.
That’s why the Labor Department measures unemployment in six ways, total: from the U1 rate to the U6 rate. The U-6 rate is the broadest measure there is – and it’s often taken even more seriously.
“A number of people call it the real unemployment rate,” says Dan North, chief economist at Euler Hermes. “You can’t look at the unemployment rate in isolation.”
U-6 rate
The BLS’ U-6 rate tracks all unemployed individuals tabulated in the U-3 rate, plus:
- Discouraged workers: Those who’ve looked for a job at some point over the past 12 months but have stopped searching because they don’t believe there’s a job available.
- Other “marginally attached” individuals: Those who’ve looked for a job at some point over the past 12 months but haven’t searched in the past four weeks for reasons other than being discouraged.
- Part-time workers for economic reasons: Those who would prefer to work full-time but can’t find any open positions.
Other unemployment rates
The other rates are less broad than the U-6 measure. If you want to know how many individuals have been unemployed for 15 weeks or longer – otherwise known as “long-term unemployed” – look out for the U-1 rate. If you want to know how many individuals have lost their job and how many individuals completed temporary work, that’s where you’d turn to the U-2 rate.
The U-4 rate tracks discouraged workers and the total unemployed, while the U-5 rate tracks all individuals marginally attached, plus discouraged workers and the total unemployed. The segmentation allows you to analyze who’s given up on looking for a job.
Because these individuals haven’t sought out a job in the past four weeks, they’re not counted in the headline unemployment rate that most people pay attention to.
All of these rates tend to follow the same path, but they took on even bigger importance during the previous economic expansion. The unemployment rate dipped to levels that hadn’t been seen since the 1960s, yet wage growth never perked back up like economic theory suggested it would.
The U-6 rate taught experts that the job market might not be as prosperous as the headline number might suggest.
“It’s a useful measure for capturing a bunch of different ways that people’s work can be disrupted, not just folks who have lost the job,” says Nick Bunker, economics research director at the Indeed Hiring Lab. “It captures some of the other factors that your headline unofficial unemployment rate does not at all.”
What this means during the coronavirus crisis
The coronavirus is also one of those times where you might want to take what the headline unemployment rate tells you with a grain of salt.
That’s because stay-at-home orders nationwide have kept jobseekers at home, meaning many are not applying for new positions after they’ve been laid off. At the same time, others have simply seen their hours cut or are working part-time work involuntarily, meaning they’re not included in the most well-known rate for joblessness.
“People in the vulnerable populations because of pre-existing [conditions] or because they’re older – they’re not looking for a job,” says Alexander Bick, associate economics professor at Arizona State University. “They’re not considered unemployed anymore, but we certainly would think in the sense of an unemployed person that they are.”
Bick, along with Virginia Commonwealth University’s Blandin, have been co-authoring a “Real-Time Population Survey” every two weeks, giving policymakers and economists an added measure of tracking the coronavirus’ effects on the labor market. Their research suggests that unemployment topped 20 percent at the end of March but fell down to 16 percent. But that wasn’t because the job market improved. It was because people dropped out of the labor force.
A good way of telling whether the headline unemployment rate is getting suppressed is paying close attention to the percentage of the population that belongs to the labor force.
“Suppose 100 people out of 330 million are working, and one of them is unemployed. That’s a 1 percent unemployment rate,” North says. If that few people are participating, “We’d have a disastrous economy. You have to look at how many are actively participating in the labor market and in the economy.”
But the most important labor market indicator right now might be the “employment” rate, specifically those for prime-age workers between the ages of 25 and 54, Bunker says. This rate tracks the percentage of the working-age population that has a job.
“It’s done a good job during this past recovery of really capturing the strength of the labor market and predicting wage growth,” Bunker says.
Why does unemployment keep rising even after recessions end?
In normal times, the unemployment rate doesn’t skyrocket as quickly as it did during the coronavirus crisis. Usually, it follows gradual upticks.
It’s typically notable if the unemployment rate rises about 50 basis points over a certain period of time. That’s known as the “Sahm rule,” from former Fed economist Claudia Sahm.
You’ll also notice that the unemployment rate keeps on rising well beyond a recession’s “endpoint.” But that’s really because unemployment lags behind the rest of the economy. When a recession ends, it doesn’t mean the good times are back. From an economist’s standpoint, it just means that things aren’t as bad as they once were. It’s also why it takes a while for joblessness to return to pre-recession levels.
“When a recession is over, the economy has stopped receding. It doesn’t mean the economy is good, it just is not getting worse,” North says. “If you’re in business, and you still see business conditions much poorer than you were before, you are going to be in no hurry to hire people.”
How the unemployment rate impacts you
When unemployment is low, it might be time to prioritize paying off debt. The Fed typically raises interest rates in these times to prevent a run up in inflation. You’ll want to make headway on your payments before the cost of borrowing money gets more expensive.
But when unemployment rises, it’s generally a good time to focus on boosting your emergency savings and paying off debt. Even if your industry hasn’t been hit hard, your work could still feel ripple-effects of a slowing economy as consumers keep pulling back on spending. Experts typically recommend keeping three to six months’ worth of expenses in a liquid and accessible vehicle, such as a savings account.
If you’ve lost your job, look into applying for unemployment benefits and contacting your bank and loan servicers about any goodwill programs that can offer temporary financial reprieve.
No one knows how long the coronavirus crisis will last, and that uncertainty could lead to less job creation down the road, with employers likely slowing their pace of hiring.
“There’s so much uncertainty now, and there is concern that the recession is going to lead to job losses or loss of businesses,” Bunker says. “If that reduces the number of employers out there, hiring will be worse moving forward.”
Learn more:
- Furloughed? In the eyes of mortgage lenders, it’s the same as being laid off
- When will the U.S. economy get back on track following coronavirus shock? Watch for these 5 signs
- Stimulus checks: What consumers should consider doing with the money
Why we ask for feedback Your feedback helps us improve our content and services. It takes less than a minute to complete.
Your responses are anonymous and will only be used for improving our website.