What is inflation? Here’s how rising prices can erode your purchasing power


Key takeaways
- Inflation is a sustained increase in prices of goods and services, which can negatively impact your purchasing power and stretch your budget.
- The Federal Reserve targets a 2% annual inflation rate as a sign of a healthy economy.
- Inflation can be caused by a variety of factors, such as increased production costs or high demand for goods and services, as well as expectations for higher inflation.
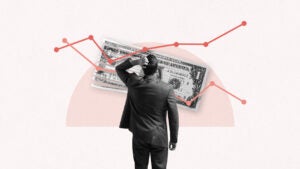
No one wants to take a pay cut — but with inflation, Americans often have no choice.
As Americans emerged from coronavirus pandemic lockdowns with cash to burn and a willingness to spend, inflation became a real threat to both household income and the broader economy for the first time since the 1980s. It’s an economic phenomenon that has a nasty reputation among policymakers, investors and consumers alike.
Prices are up 25.1 percent since February 2020, when the National Bureau of Economic Research declared that the outbreak-induced recession began, according to the Bureau of Labor Statistics. It means that Americans would need about $1,251 to buy the same goods and services that originally cost $1,000. Those small changes can add up over time, with the extra expenses totaling close to $3,012 over a 12-month period.
High inflation has consequences beyond just affordability, complicating saving for emergencies or investing for retirement. Not to mention, officials on the Federal Reserve rapidly raised interest rates to get the burst in U.S. cost-of-living under control, even if it meant risking a recession or a slowdown in the job market. Fed officials have now cut their key benchmark interest rate more than a percentage point from its peak, and they are expected to lower interest rates again at their next meeting in October.
Despite the lack of labor market data due to the government shutdown, this lighter-than-expected CPI report should offer a confidence boost to a Federal Reserve that already appeared inclined toward additional rate cuts in October and December.— Stephen Kates, CFP, Bankrate financial analyst
Not all inflation is bad inflation, and prices rise and fall across the economy all the time due to supply- and demand-related factors. Here’s a breakdown of what inflation is and isn’t, as well as why it matters so much for your wallet.
The latest insights on inflation
Prices in September rose 3% from a year ago, up from last month’s 2.9% annual rate and the highest level since January 2025, according to the Bureau of Labor Statistics consumer price index (CPI).
Excluding food and energy, prices have risen at a 3% annual rate, a slight cooldown from 3.1% last month, according to the BLS.
Inflation had been steadily approaching the Federal Reserve’s target of a 2% annual inflation rate, but tariffs have disrupted that progress. Prices, however, haven’t risen as rapidly as many economists feared.
What is inflation?
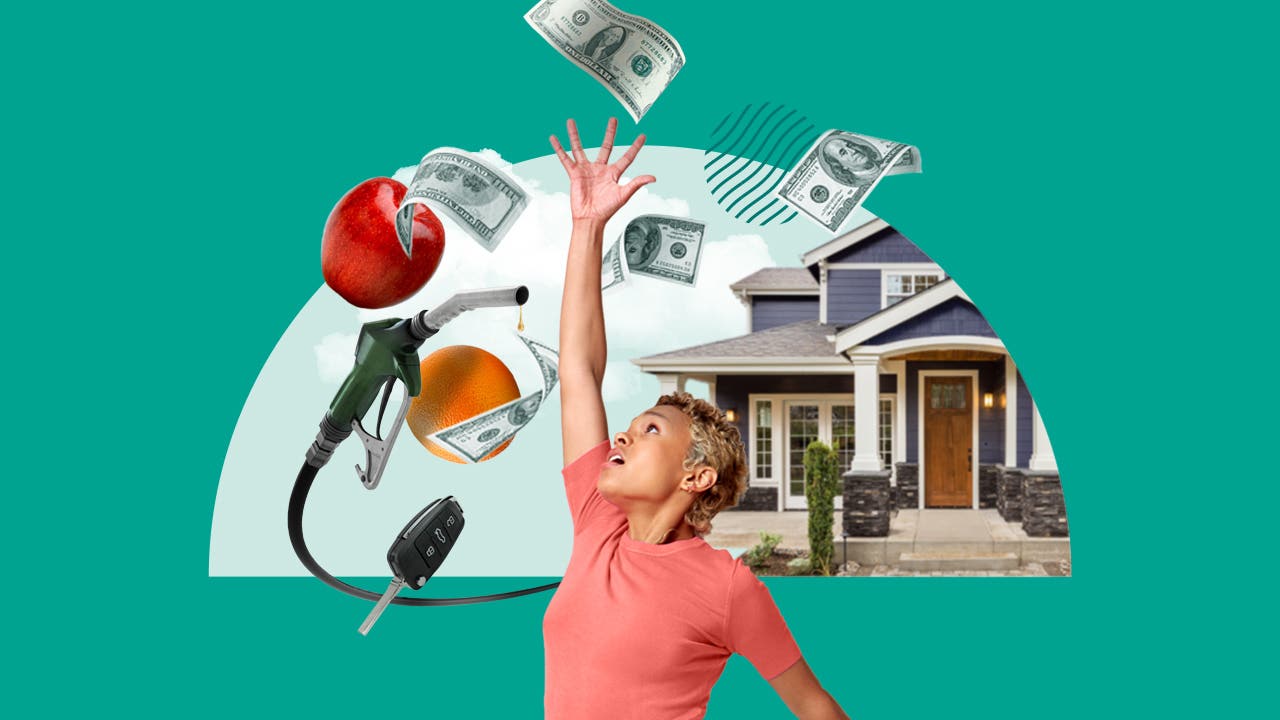
Inflation occurs when the items that consumers regularly buy — from services such as haircuts or medical care to goods including appliances and furniture — increase over a sustained period of time. Inflation doesn’t happen overnight, and it also doesn’t happen when the cost of one particular product increases.
Say you go to the grocery store and buy a dozen eggs for $2. Then, the next week, that same product is now $4. That price jump alone doesn’t count as inflation, as prices in the financial system constantly fluctuate — food and energy costs especially. Instead, inflation applies to the broader picture.
“We may see prices rise on certain things like gas or milk, but it’s not necessarily inflation unless you see prices rising sort of across the board, across many different products and services,” says Jordan van Rijn, who teaches agricultural and applied economics at the University of Wisconsin’s Center for Financial Security.
How much inflation is too much inflation?
Every year, prices should be rising throughout the U.S. economy. A little bit of inflation is seen as a sign of a healthy economy, helping ensure businesses can keep hiring and consumers’ paychecks can keep growing. Fed officials target a 2 percent annual inflation rate — now the common goalpost for inflation considered to be just right.
“That basically gives the economy the ability to slowly raise prices,” says John Cunnison, CFA, vice president and chief investment officer at Baker Boyer Bank. “For companies, they can slowly increase people’s wages. You’re really looking at the goldilocks inflation — not too little, not too much.”
The wallet-harming kind of inflation, however, happens when prices burst at a rate much faster than 2 percent and Americans’ paychecks can’t keep up. Consumers end up having to make tough decisions about what to buy and what to hold off on. Sometimes, they may have no way of avoiding those price pressures if inflation is impacting key essentials, turning to credit card debt. Unpredictable price increases can also be an issue for the economy, making it harder for businesses to price set and prepare for the future.
How inflation is measured
Primarily, there are two main ways to measure inflation:
- The Bureau of Labor Statistics’ consumer price index (CPI); and
- The Department of Commerce’s personal consumption expenditures (PCE) index.
CPI matters primarily for consumers. BLS regularly provides information on how prices are changing on almost 400 individual items, getting as specific as peanut butter or stationery. The Social Security Administration (SSA) uses a subset of CPI to determine its annual cost-of-living adjustment (COLA), while the Internal Revenue Service (IRS) even uses CPI to inform adjustments to federal tax brackets — making the index consequential for hundreds of millions of Americans.
PCE, on the other hand, is crucial for the Fed — but its impact on consumers is still huge, albeit indirect. Policymakers use this gauge to help determine what to do next with their key benchmark interest rate that influences how much consumers pay to borrow money. Officially, they target PCE, instead of CPI.
That preference matters because the two indexes show different pictures of inflation. While both measures capture the same trends, CPI has historically tended to rise faster than PCE, mainly because the indexes use different formulas and weights to calculate inflation.
Meanwhile, CPI looks exclusively at how much consumers pay for specific goods and services, while PCE looks at both consumer data and business expenditures. PCE also takes consumers’ substitutions into account. Someone who replaces meats with seafood one month because it’s cheaper, for example, might not see as high of food costs.
How economists track inflation
To get a sense of the broader inflationary picture, economists typically track year-over-year changes in the overall price index level, which helps squeeze out temporary increases or dips as well as seasonal factors. They also analyze three- and six-month moving averages to help shine a light on recent trends. Stripping out the volatile food and energy categories, meanwhile, generates a look at underlying inflation, often referred to as “core” prices.
How consumers track inflation
Households, however, have completely different perceptions of the U.S. economy.
For starters, many tend to pay attention to price levels, rather than rates of change. Slowing inflation, for instance, doesn’t mean prices are falling — just that they’re not rising as quickly as they once were. Consumers who remember how much it cost to buy a cart of groceries or fill up their gas tank might still feel the pinch of inflation.
Meanwhile, not all households buy the same goods. The inflation rate consumers experience depends on what they buy, meaning someone’s personal inflation rate might end up being lower, or higher, than the overall index. Drivers, for example, might be dealing with a greater inflationary pinch than someone who takes public transportation, as insurance and repair costs continue to surge. Families might also feel like inflation is even worse if they’re sending their children off to college or paying for medical care — two categories that have outpaced overall inflation.
What are the causes of inflation?
Economists mainly lump the causes of inflation into two categories: demand-pull and cost-push inflation. Those terms sound wonky, but they reflect experiences that many Americans are familiar with — especially after the coronavirus pandemic.
Yet, other forces that don’t clearly fit into any category can be at play. And as was the case after the outbreak, all of those inflationary forces can intersect, creating a price problem that’s even more difficult to solve.
1. Cost-push inflation
Cost-push inflation occurs when prices increase because production is more expensive — whether it’s because of higher wages or material prices. Companies pass along those higher expenses by raising prices, which then cycles back into the cost of living.
Higher lumber costs, more expensive energy or electricity bills and pricier food expenses post-pandemic forced builders, factories and even restaurants to raise prices.
2. Demand-pull inflation
On the flip side, demand-pull inflation occurs when consumers have resilient interest for a service or good. Such demand could result from things like a low jobless rate, strong consumer confidence or low interest rates. Companies, however, can’t always keep up with that robust demand, leading to product shortages and, consequently, price surges.
Massive pent-up demand and a stockpile of savings thanks to lockdowns helped push up prices for the experiences consumers were deprived of: travel, concerts and sporting events as well as dining out.
3. Expectations for higher inflation
Even the mere expectation of higher prices can be a bad prophecy. If consumers start expecting prices to pop, they’re more likely to panic buy or demand higher wages. Those two forces combined create the very phenomenon consumers were worried about.
“If people think inflation will be high, prices are going to continue to rise,” says van Rijn. “If you’re an executive setting wages at your company, that depends a little bit on your expectations for how much prices are going to increase next year. As wages go up, then the same thing happens with businesses — they’re going to start raising their prices.”
As consumers tried to catch up to the massive burst in post-pandemic prices, workers said in a 2023 Bankrate survey that higher pay was the most important quality in their employment moving forward. In Bankrate’s 2024 Employment Security Survey, more than 2 in 5 workers (43%) said they were likely to ask for a raise at some point in the next 12 months.
| Factors that heat up inflation | Factors that cool inflation |
|---|---|
| Increased consumer or government spending, especially spending that takes on debt | Reduced consumer or government spending |
| Increasing money supply | Decreasing or slower-growing money supply |
| Deficit spending, that is, lower taxes without corresponding cuts in government spending | Government surpluses, that is, tax revenues are greater than spending |
| Interest rates that are below the neutral rate of inflation, or increases in the money supply | Interest rates that are above the neutral rate of inflation, or declines in the money supply |
| Highly consolidated industries that push through price increases or pass on their own cost increases | Fragmented industries that have little pricing power |
| A wage-price spiral, in which growing wages push up the price of goods and so workers demand higher wages to compensate | Consumers saving more than they did before, or increases in the net saving rate |
| Expectations of higher inflation in the future | Expectations of lower inflation in the future |
| Supply shocks that sharply reduce output, such as the oil shock of the 1970s | Rapidly increasing supply, perhaps through a technological breakthrough |
| Elevated consumer demand, thanks to an improving job market and widespread employment | Slumping demand, likely caused by a jump in joblessness or a recession |
Brief history of U.S. inflation
High inflation was last a major problem during the 1970s and 1980s — reaching 12.2 percent in 1974 and 14.6 percent in 1980 — when the central bank didn’t curb demand enough with higher interest rates during a time of big government spending and two oil-price shocks.
Then-Fed Chair Paul Volcker decided to drastically change the way Fed officials set interest rates and push those borrowing costs all the way up to a range of 19-20 percent, the highest target range for the benchmark federal funds rate on record. Unemployment spiked, and the economy faced its worst recession since the Great Depression. However painful, the strategy worked. Inflation steadily cooled through the first half of the decade, sinking to 1.2 percent by December 1986.
Since then, inflation hadn’t proved to be much of a threat — until now. Prices rose an average of 2.4 percent a year between 1990 and the end of 2019, and inflation coming out of the Great Recession of 2007-2009 proved to be tepid at best despite ultra-low interest rates. Economists mainly blamed a slow post-financial crisis recovery, along with other disinflationary factors, such as globalization, technological innovations and an aging population. But consumers might be surprised to recall that the Fed spent the era actually fearing too-low inflation, thinking that it might make it harder to stimulate the economy if a recession were to occur.
What's the latest on inflation?
Check out Bankrate's analysis on where prices are currently rising the most and what's still most expensive since the pandemic.
Read moreTypes of extreme inflation
Rapid inflation can always be painful, but there are other flavors of price pressures that can be even more dangerous for the economy and Americans’ purchasing power.
1. Stagflation
Stagflation occurs when unemployment is rising, demand is slowing, economic growth is slipping — but contrarily, inflation isn’t budging. Typically, slowing growth and rising unemployment have an inverse relationship with inflation. Fewer paychecks weigh on spending; less spending weighs on businesses being able to expand or invest.
Only a set of specific conditions lead to this type of inflation. Typically, supply shortages that continue to weigh on the U.S. economy’s productive capacity are a main ingredient. There are also varying degrees of stagflation. In the worst of scenarios, the financial system could be in a recession as inflation surges. In milder, yet still painful, cases, growth might just be lukewarm.
At any rate, the environment proves especially challenging because the traditional way of controlling inflation — raising interest rates — isn’t as immediately effective.
2. Hyperinflation
Hyperinflation occurs when prices rise massively, sometimes considered to be at a rate of around 50 percent each month. Think: 1920s Germany or the current economies of Venezuela or Zimbabwe. But only a rare combination of policymaking missteps lead to this environment, from exploding government spending and debts to a rapid increase in the nation’s money supply.
How can consumers protect against inflation
- Find the best place to park your cash: Not all inflation is bad inflation, but consumers who keep their money under the mattress or at a brick-and-mortar bank are bound to lose ground to inflation. Historically speaking, investing in financial markets has been the best way to grow your purchasing power over time, whether you’re 50 years or 50 days away from retirement. Yet, Bankrate’s picks for the top high-yield savings accounts still feature yields higher than the overall rate of inflation, helping Americans hang onto their purchasing power.
- Keep a budget: Periods of high inflation underscore the importance of keeping a close watch over your budget. Make sure you’re aware of how much you’re spending and how much you can afford to spend.
- Shop around for the most affordable prices: When prices are rising across the board, it’s hard to escape inflation, but utilizing technology to find the cheapest product on the market and compare options could translate to significant savings in the long run. Better yet, find coupons or see if any retailers price check.
- Keep an emergency fund: Consumers may think it’s unwise to keep too much cash on the sidelines when they’re fearful about losing their purchasing power, but it’s during those times when they should concentrate on building up a cushion of cash they most. Recession risks are never zero, especially when interest rates remain elevated and tariffs threaten to slow economic growth.
Why we ask for feedback Your feedback helps us improve our content and services. It takes less than a minute to complete.
Your responses are anonymous and will only be used for improving our website.

Sarah Foster is a former U.S. economy reporter and analyst for Bankrate. She’s covered the Federal Reserve and U.S. economy since 2018, when she joined the economics news team at Bloomberg News.