Which presidents brought the best stock market performance?
The Bankrate promise
At Bankrate we strive to help you make smarter financial decisions. While we adhere to strict , this post may contain references to products from our partners. Here's an explanation for .
President Harry Truman famously had a sign on his desk that read “The Buck Stops Here.”
If that’s the case when it comes to the stock market, it’s fair to wonder how well your portfolio will do under President Donald Trump.
But which presidents brought out the bulls, and which ones fed the bears, might surprise you.
For example, few people would probably cite Calvin “Silent Cal” Coolidge as their favorite president, but Coolidge presided over a 209 percent run-up in stock prices, the largest of any president after 1900, according to S&P 500 composite data gathered by Yale economist Robert Shiller. (Of course, the fact that the stock market crash that touched off the Great Depression occurred the same year he left office takes a little bit of the luster off that achievement).
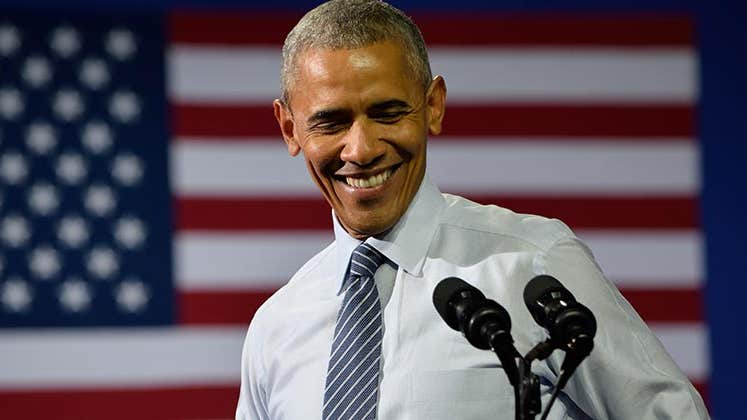
Look at the graphic here to see how well Trump will have to do to keep up with his predecessor, President Barack Obama, and how other presidents since 1900 stack up.
| Average monthly return | President, year term started | S&P composite | Stock price change over presidency |
|---|---|---|---|
| 1.74% |
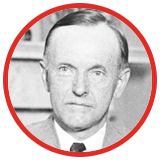
Coolidge, 1923
|
208.52% | |
| 1.22% |

Clinton, 1993
|
202.38% | |
| 1.03% |

Obama, 2009
|
166.14% | |
| 1% |
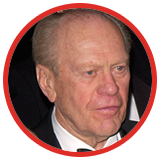
Ford, 1974
|
36.53% | |
| 0.93% |
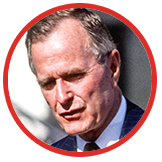
H.W. Bush
1989
|
48.04% | |
| 0.91% |
Eisenhower, 1953
|
130.94% | |
| 0.87% |
Reagan, 1981
|
122.27% | |
| 0.73% |
Truman, 1945
|
83.33% | |
| 0.71% |
F.D. Roosevelt, 1933
|
123.6% | |
| 0.64% |
Kennedy, 1961
|
16.81% | |
| 0.58% |
Johnson, 1963
|
37.52% | |
| 0.57% |

Carter, 1977
|
31.68% | |
| 0.52% |
Harding, 1921
|
17.15% | |
| 0.17% |
T. Roosevelt, 1901
|
10% | |
| 0.07% |
Taft, 1909
|
0.56% | |
| -0.19% |
Wilson, 1913
|
-19.77% | |
| -0.31% |
Nixon, 1969
|
-21.86% | |
| -0.36% |
W. Bush, 2001
|
-33.71% | |
| -2.23% |
Hoover, 1929
|
-75.42% |
Source: S&P Composite Stock Price Index compiled by Robert Shiller.
Image credits: H. W. Bush: Rob Crandall/Shutterstock.com; W. Bush: Northfoto/Shutterstock.com; Carter: Nir Levy/Shutterstock.com; Clinton: Everett Collection/Shutterstock.com; Coolidge: Everett Historical/Shutterstock.com; Eisenhower: Moore/Getty Images; Harding: Everett Historical/Shutterstock.com; Hoover: Harris & Ewing/Library of Congress; Johnson: Agence France Presse/Getty Images; Kennedy: Bachrach/Getty Images; Obama: Evan El-Amin/Shutterstock.com; Nixon: Bachrach/Getty Images; Reagan: Joseph Sohm/Shutterstock.com; F. D. Roosevelt: UniversalImagesGroup/Shutterstock.com; T. Roosevelt: Everett Historical/Shutterstock.com; Taft: Everett Historical/Shutterstock.com; Truman: PhotoQuest/Getty Images; Wilson: Everett Historical/Shutterstock.com
Methodology: Average monthly return and stock market price change were calculated using S&P 500 composite data gathered by Yale economist Robert Shiller. Presidents who served their full term since 1900 were considered, and presidents were given "credit" for months in which they served the majority of days as president.
Related Articles

The Dow crossed 40,000 for the first time – Should you keep investing in stocks or wait?