What disasters does home insurance cover?


Owning a home is an impressive financial feat; in fact, 78 percent of U.S. adults say owning a home is part of the American Dream, according to Bankrate’s Home Affordability Survey. But, in an era when droughts are drier, fires burn wilder, downpours are heavier and storms are more severe, the achievement of homeownership can be wiped out by one catastrophic event. Having a home insurance policy in place is a great first step in preparing for a natural disaster, but getting familiar with what kinds of extreme weather events are — and aren’t — included in your policy can help you avoid a coverage gap. Before bad weather hits, take a moment to get familiar with what disasters home insurance covers.
Key natural disaster facts
- In 2024, the U.S. experienced 27 extreme, billion-dollar weather events. (NOAA)
- 90 percent of natural disasters in the U.S. involve flooding — but flood damage is not covered by a home insurance policy. (Department of Homeland Security)
- Hurricane Katrina, which hit Louisiana in 2005, was the worst natural disaster in U.S. history in terms of insured losses (NOAA).
- Although the majority (57 percent) of U.S. homeowners have taken action to mitigate the effects of extreme weather, more than 1 in 4 (26 percent) homeowners say they are unprepared for the potential costs associated with extreme weather in their area. (Bankrate Extreme Weather Survey)
Does home insurance cover natural disasters?
The goal of homeowners insurance is to offer financial protection when your home or personal property is damaged in a covered incident. There are several types of homeowners insurance for different kinds of dwellings and coverage levels. The HO-3 Special Form is the most common type of home insurance policy and the one we will refer to in this article.
If you have another type of home insurance, condo policy or renters insurance, coverage from natural disasters is likely similar, but you may want to speak with your agent to review how your policy coverage may differ.
A standard HO-3 policy usually includes the following coverage types:
- Coverage A: Dwelling
- Coverage B: Other structures
- Coverage C: Personal property
- Coverage D: Loss of use
- Coverage E: Personal liability coverage
- Coverage D: Medical payments to others
Coverages A, B and C are usually the most impacted by natural disasters. The Coverage D part of your policy can also come into play if your home is damaged enough by extreme weather to render your home uninhabitable. With an HO-3 policy, your dwelling and other structures are protected on an “open-peril” basis. This means that you can file a claim for any kind of weather damage, except for the ones specifically excluded from your policy.
Your personal property, on the other hand, is covered on a “named-peril” basis. Coverage here is more limited, as you are only protected against specific causes of loss listed in your policy.
That said, home insurance policies can be modified. You can purchase add-on coverage, called endorsements, from your insurance company to broaden your protection.
Which disasters are covered by homeowners insurance?
Before you assume you are covered for a natural disaster, consult your home insurance agent or policy documents to be sure. Policy type, endorsements and exclusions can impact your coverage. Also, where you live, state laws and your insurance company’s underwriting criteria all play a part in how and when you have insurance coverage.
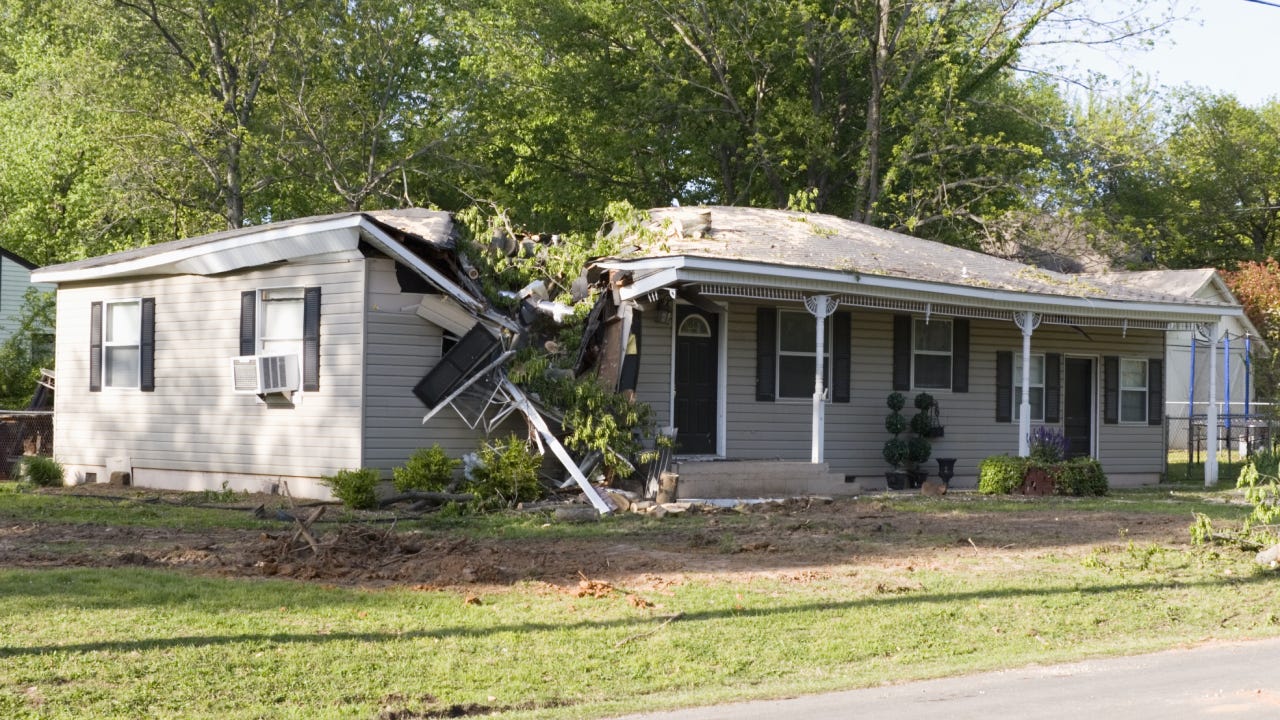
Tornadoes
Tornadoes can cause damage to your dwelling, other structures and personal property with high winds, hail, flying debris and fallen trees. Most dwelling and personal property coverage will protect you financially from these types of damage. For instance, if wind or hail damages your roof and it causes rainwater to damage your home, you should be covered unless your policy excludes these perils. Some areas prone to tornadoes may require separate deductibles for wind or hail, called disaster deductibles. Flood damage resulting from a tornado is not covered under any standard homeowners insurance policies but would be covered under a separate flood insurance policy.
Hurricanes
Like tornadoes, hurricanes can cause both damage to a dwelling, other structures and personal belongings. Hurricane damage caused by wind and hail is typically covered, though there may be limited coverage or a separate, higher deductible if you live in a coastal area. Many homeowners in high-risk hurricane areas must purchase additional windstorm insurance for adequate coverage. Again, flood damage is not covered unless you purchase a separate flood insurance policy.
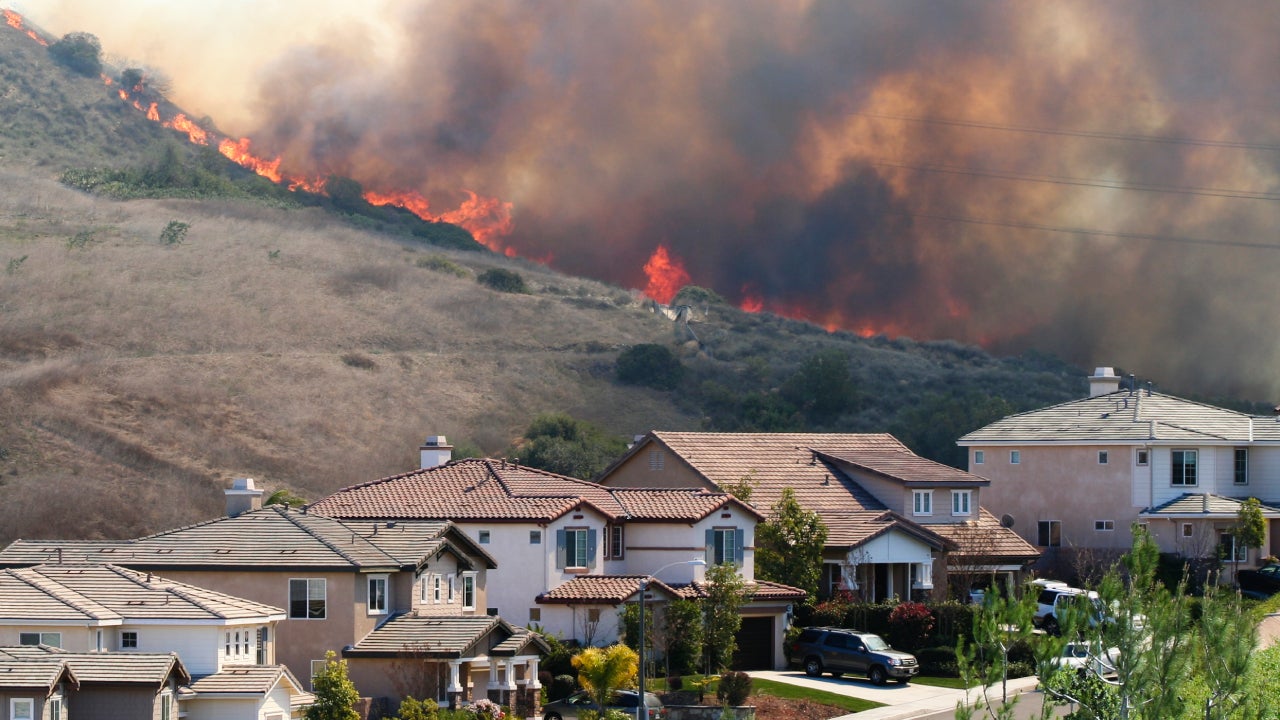
Fire
Under a standard homeowners insurance policy, your dwelling and personal property are both covered if a fire causes damage. Your policy limits are typically the only restrictions for fire coverage unless you live in an area prone to wildfires or the fire was intentionally set by the policyholder. In wildfire-prone areas, wildfire is sometimes excluded as a peril. Tear-down and removal of damaged materials and belongings are also covered. High-value items like jewelry and fine arts may have limited or no coverage if they are not scheduled property.
Explosion
If something explodes in or around your home, it is typically a covered peril. Your dwelling and personal property coverage should both pay if either is damaged because of an accidental explosion. An explosion caused by riot or civil commotion should also be covered.
Lightning
A lightning strike could cause a fire, damage your home wiring or create a surge that ruins expensive electronics. Standard homeowners insurance coverage typically provides coverage for your dwelling and personal property, even if lightning strikes a tree and damages your home or belongings. The cost to remove the tree may not be covered, though, so be sure to check your homeowners insurance policy.
Volcanoes
A volcanic eruption could also produce ash, dust, lava flow and shock waves. Homeowners insurance will usually cover damage to the dwelling and personal property. A resulting explosion or fire should also be covered. Earth movement, landslides, tremors, mudslides or earthquakes caused by a volcano are not usually covered under homeowners insurance.
Extreme cold
Most standard homeowners insurance policies cover the dwelling and personal belongings if they are damaged because of extreme cold. If a pipe bursts due to the cold, the pipe may not be covered, but the damage it causes should be. Damage caused by the weight of ice, snow or sleet and wind-driven freezing rain or snow is also usually covered if it damages the home or your personal property. If melting ground snow seeps into the home and causes water damage, that is usually not covered and would instead fall under a separate flood insurance policy.
Hurricane season 2025
Which disasters are not covered by homeowners insurance?
Though most natural disasters are covered by homeowners insurance, there are a few that are not covered.
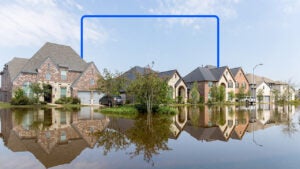
Floods
Flood coverage is excluded from homeowners insurance policies. However, climate change has caused devastating flood events to happen more frequently across the country, especially in recent years.
Homeowners can purchase private flood insurance as a separate policy or purchase one from the National Flood Insurance Program (NFIP). The average flood claim paid by the NFIP from 2016 to 2022 was more than $66,000. The cost of flood insurance varies by state and where your home lies on the flood risk map. As of October 2024, the average cost of flood insurance was $870. However, this amount will increase.
The NFIP has revamped its flood mapping and pricing to make flood insurance premiums more equitable, accurate and sustainable. The average risk-based cost of insurance is about $1,808. While the true cost of flood coverage differs for everyone, policyholders will see their current insurance premium increase yearly until it matches NFIP’s risk-based cost.
Earthquakes
Though earthquakes are not covered under a homeowners insurance policy, most carriers offer an endorsement you can add to the policy for an additional cost. If you live in California, you will likely need to purchase a separate earthquake insurance policy. Almost half of the U.S. states are at risk of earthquake damage.
The average cost for earthquake insurance is between $100 and $300 per year. If you cannot afford to replace your belongings or rebuild your home if damaged, it may be a good idea to speak with your insurance agent to discuss earthquake insurance. However, be aware that earthquake deductibles tend to be on the higher side, and are usually somewhere between 10 and 20 percent of your total coverage limit.
Tsunami
A tsunami is a giant wave that can travel far inland, typically caused by earthquakes or underwater volcanic eruptions. Though these devastating waves are not covered by homeowners insurance, you can purchase flood insurance, which will provide coverage for the damage caused by tsunami waves.
Nuclear event
A nuclear event or explosion could cause slight damage or completely wipe out your home. Though your homeowners insurance will not cover a nuclear event, plants are required to carry liability insurance to protect the public if they are injured or have property damage.
What to do if you have experienced a natural disaster
Experiencing a natural disaster can be devastating, especially if you have a catastrophic home or personal loss. To prevent damage and stay safe during a natural disaster, have an emergency kit packed and ready to use. Depending on where you live, you can use sandbags and other building materials like plywood to prevent water from entering the house and high winds or debris breaking windows or doors.
It is also a good idea to speak with your home insurance company to determine what type of coverage you have to make sure you are covered for damage caused by natural disasters. If there is damage after a natural disaster, assess the damage, file a claim as soon as possible, keep track of expenses and make temporary repairs if necessary while waiting for the claims adjuster. There are also typically community resources such as government programs and non-profits available and ready to help after a natural disaster.
Home insurance covers some, but not all, natural disasters. Reading your policy can help give you a better understanding of what’s covered in your policy — and, just as importantly, what isn’t covered. When in doubt, set aside some time to speak with a licensed agent to make sure your policy includes what you need.
Frequently asked questions
Why we ask for feedback Your feedback helps us improve our content and services. It takes less than a minute to complete.
Your responses are anonymous and will only be used for improving our website.

You may also like

How to get flood insurance coverage and who needs it
The impact of natural disasters on insurance rates in 2024