| 05/07/2026 |
Bankrate Historical Interest Rate Data Now Available Through Federal Reserve Economic Data (FRED)
|
pdf |
| 03/04/2026 |
More Americans Are Falling Victim to Financial Fraud and Scams
|
pdf |
| 02/09/2026 |
Most Couples Keep At Least Some Of Their Money Separate
|
pdf |
| 02/04/2026 |
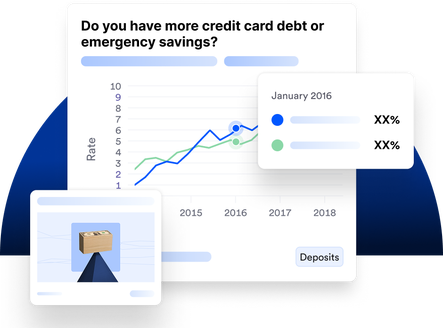
44% of Americans Have More Emergency Savings Than Credit Card Debt
|
pdf |
| 01/29/2026 |
43% Believe Financial Infidelity is at Least as Bad as Physical Cheating
|
pdf |
| 01/21/2026 |
Just 30% of Americans Say They Would Pay an Emergency Expense of $1,000 From Savings
|
pdf |
| 01/12/2026 |
Long-Term Credit Card Debt Is On The Rise: 61% With Credit Card Debt Have Had It For At Least A Year
|
pdf |
| 12/15/2025 |
Fewer Americans Believe Their Finances Will Improve In 2026, While The Number of Americans Who Believe Their Finances Will Get Worse Hits A New High
|
pdf |
| 12/08/2025 |
Nationally, More than 75% Of Homes on the Market Are Unaffordable to the Typical Household
|
pdf |
| 12/03/2025 |
Fewer Americans Plan to Give Holiday Tips This Year
|
pdf |
| 11/19/2025 |
Increasing Earnings, Not Lower Spending, Is The Main Driver For Growing Emergency Savings
|
pdf |
| 10/27/2025 |
Talking About Money Is More Taboo Than Politics, Religion and Weight
|
pdf |
| 10/23/2025 |
Bankrate Appoints Matt Fellowes as CEO
|
pdf |
| 10/22/2025 |
52% of Non-Retired Americans Expect to Rely on Social Security to Pay Necessary Expenses
|
pdf |
| 10/14/2025 |
62% of Workers Say Their Pay Has Not Kept Pace With Inflation, The Highest In Four Years Of Polling
|
pdf |
| 10/08/2025 |
Fewer Americans Plan to Travel for Thanksgiving, Winter Holidays This Year
|
pdf |
| 09/29/2025 |
One in Six Aspiring Homeowners Have Given Up in the Last 5 Years
|
pdf |
| 09/25/2025 |
Drivers Face Nearly $7,000 Per Year in Hidden Car Expenses as Costs Rise Nationwide
|
pdf |
| 09/24/2025 |
A Majority of American Workers Say They’re Behind on Retirement Savings
|
pdf |
| 09/15/2025 |
Average Retail Credit Card APR Remains Above 30%, Near a Record High
|
pdf |
| 09/10/2025 |
ATM Fees Hit Record High for Third Consecutive Year
|
pdf |
| 09/08/2025 |
41% of Holiday Shoppers Are Concerned That Holiday Gifts Will Be More Expensive This Year
|
pdf |
| 08/25/2025 |
National Average Cost of Home Insurance in the United States is $2,470
|
pdf |
| 08/20/2025 |
Nearly 3 in 4 Americans Have a Financial Regret in 2025; Retirement and Credit Card Debt Top Regrets
|
pdf |
| 08/18/2025 |
Four Years After The Pandemic Spike, Wages Still Haven’t Fully Caught Up To Inflation
|
pdf |
| 08/13/2025 |
The States with the Most and Least Home Equity Gains
|
pdf |
| 08/06/2025 |
The “Subprime Tax” Costs Low-Credit Households 4% of Median Income
|
pdf |
| 08/04/2025 |
Housing Market Heat Shifts Away From Popular Pandemic Metros
|
pdf |
| 07/24/2025 |
Nearly Half of Workers Are Likely to Search for a New Job in the Next 12 Months
|
pdf |
| 07/21/2025 |
New England Has Some of the Best States for Retirees; Sun Belt Has Some of the Worst
|
pdf |
| 07/16/2025 |
Nearly 1 in 4 Credit Card Debtors Believes They Will Never Get Out of Credit Card Debt
|
pdf |
| 07/14/2025 |
Lock-In Effect Continues: More Americans Are Reluctant to Sell Their Homes This Year
|
pdf |
| 07/09/2025 |
Fewer Americans Have a Side Hustle in 2025
|
pdf |
| 06/26/2025 |
Fewer Than Half of Americans Have Enough Emergency Savings to Cover 3 Months’ Expenses
|
pdf |
| 06/23/2025 |
More Than 1 in 4 Americans Feel They Need To Make At Least $150,000 A Year To Live Comfortably
|
pdf |
| 06/16/2025 |
65% of Americans Believe Tariffs on Imported Goods Will Have a Negative Impact on their Personal Finances
|
pdf |
| 06/09/2025 |
Hidden Costs of Homeownership Average $21,400 Annually Nationwide, Nearly Twice the Cost of the Lowest Cost State
|
pdf |
| 06/04/2025 |
63% of Americans Have a Negative View About Tipping, with 41% Saying Tipping Culture Has Gotten Out of Control
|
pdf |
| 05/21/2025 |
Top U.S. Vacation Spots with the Biggest Seasonal Rental Hikes
|
pdf |
| 05/19/2025 |
More Than Half of Americans Anticipate Spending Less on Travel, Dining or Live Entertainment Purchases
|
pdf |
| 05/14/2025 |
Nearly Half of Homeowners Have at Least One Regret About the Purchase of Their Current Home
|
pdf |
| 05/05/2025 |
About Half Of Buy Now, Pay Later Users Have Experienced At Least One Financial Problem
|
pdf |
| 05/02/2025 |
Bankrate Launches Bankrate Data Center, Providing Unprecedented Access to Decades of Financial Insights and Consumer Trend Research
|
pdf |
| 04/30/2025 |
For The Third Straight Year, Money Is the Top Factor Negatively Impacting Americans’ Mental Health
|
pdf |
| 04/23/2025 |
Renting is Increasingly Cheaper Than Buying in Most Large U.S. Metros
|
pdf |
| 04/21/2025 |
Fewer Than Half of Americans Plan to Travel This Summer; Cost is a Major Concern
|
pdf |
| 04/16/2025 |
82% Consider Homeownership to be Part of the American Dream
|
pdf |
| 04/14/2025 |
Tennessee is the Easiest State in the Country to Save Money; Hawaii is the Hardest
|
pdf |
| 04/09/2025 |
64% of Credit Card Debtors Have Delayed or Avoided Other Financial Decisions Because of Their Debt
|
pdf |
| 03/31/2025 |
Americans Need a Household Income of Over $100k to Afford a Typical Home in the Majority of U.S. States
|
pdf |
| 03/26/2025 |
37% of Americans Tapped Emergency Savings in the Past Year
|
pdf |
| 03/24/2025 |
More Than 7 in 10 Credit Card Debtors Are Chasing Rewards, a Potentially Big Mistake
|
pdf |
| 03/10/2025 |
Bank Account Holders Stick with Same Accounts for Decades
|
pdf |
| 03/03/2025 |
34% Of Americans Have Experienced A Financial Scam Or Fraud In The Past 12 Months
|
pdf |
| 02/26/2025 |
4 in 5 Aspiring Homeowners Cite Down Payments and Closing Costs as a Significant Obstacle
|
pdf |
| 02/24/2025 |
66% of Americans Who Grew Up With a Financial Education Have Successfully Negotiated Pay Raises During Their Careers
|
pdf |
| 02/20/2025 |
More Than a Quarter of Americans Say the Stock Market is the Best Long-Term Investment
|
pdf |
| 02/13/2025 |
One-Third of Americans Have More Credit Card Debt Than Emergency Savings
|
pdf |
| 02/10/2025 |
National Average Cost of Car Insurance in the United States Reaches $2,638, Up 12% from 2024
|
pdf |
| 02/06/2025 |
Over 4 in 5 U.S. Adults Spend Money on at Least One of Six Financial Vices
|
pdf |
| 02/03/2025 |
Nearly Half of Loan Applicants Have Been Rejected Over The Past 12 Months
|
pdf |
| 01/27/2025 |
40% of U.S. Adults In Live-In Relationships Have Committed Financial Infidelity
|
pdf |
| 01/23/2025 |
Americans Backtrack: Just 41% Say They Could Pay A $1,000 Emergency Expense From Their Savings
|
pdf |
| 01/08/2025 |
48% of Credit Cardholders Carry Debt from Month to Month and More Than Half Have Been in Credit Card Debt for at Least a Year
|
pdf |
| 12/19/2024 |
Nearly 1 in 4 Rewards Cardholders Did Not Redeem Any Rewards Over the Past Year
|
pdf |
| 12/12/2024 |
More Americans Believe Their Finances Will Improve in 2025 Compared to Previous Years, While Majority Still Believe Their Finances Will Not Get Better
|
pdf |
| 12/11/2024 |
Bankrate Announces The Bankrate Awards Celebrating Financial Excellence and Innovation
|
pdf |
| 12/09/2024 |
More Americans Are Planning to Tip This Holiday Season, But Dollar Amounts are Flat
|
pdf |
| 12/04/2024 |
61% of Workers Received a Pay Increase Over the Past 12 Months, Down From 64% in 2023
|
pdf |
| 11/25/2024 |
Washington is the Friendliest State for Small Businesses; Louisiana is the Least Friendly
|
pdf |
| 11/21/2024 |
Over Half of Those Not Retired Expect to Rely on Social Security Benefits Upon Retiring, Yet 73% are Concerned They Won’t Get Them
|
pdf |
| 11/19/2024 |
Cyber Monday Is Projected to Be the Most Popular Thanksgiving Weekend Shopping Event
|
pdf |
| 10/30/2024 |
Over Half of Americans Made at Least One Impulse Purchase Last Holiday Season
|
pdf |
| 10/28/2024 |
Care for One Infant Costs At Least 10% of Family Annual Income in Nearly Every State
|
pdf |
| 10/23/2024 |
62% of Americans Feel Behind on Emergency Savings, But Only 20% Have More Now Than at the Start of 2024
|
pdf |
| 10/21/2024 |
More Than 4 in 5 Holiday Travelers Are Changing Their Plans Due to Inflation
|
pdf |
| 10/17/2024 |
Nearly 2 in 5 Cardholders Have Maxed Out a Credit Card or Come Close Since the Fed Began Raising Rates
|
pdf |
| 10/15/2024 |
2 in 5 Americans Say Inflation Is the Top Economic Issue for the Presidential Election
|
pdf |
| 10/07/2024 |
Talking About Money Is More Taboo Than Politics And Religion
|
pdf |
| 09/30/2024 |
The 15 Most Valuable College Majors Are All STEM
|
pdf |
| 09/25/2024 |
Majority of American Workers Feel Behind on Retirement Savings
|
pdf |
| 09/23/2024 |
Over 2 in 5 U.S. Adults Have at Least One Unused Gift Card, Totaling About $27 Billion
|
pdf |
| 09/16/2024 |
Wage Growth is No Longer on Pace to Eclipse Inflation by Q4 2024 Amid Cooling Labor Market
|
pdf |
| 09/12/2024 |
The Average Retail Credit Card Charges a Record-High APR of 30.45%
|
pdf |
| 09/09/2024 |
Roughly 1 in 4 Homeowners Are Financially Unprepared for Costs of Extreme Weather Events
|
pdf |
| 09/05/2024 |
Only 24% of Holiday Shoppers Plan to Spend More Than Last Year
|
pdf |
| 08/28/2024 |
Not Saving For Retirement and Emergencies are Americans’ Top Financial Regrets
|
pdf |
| 08/26/2024 |
Nearly Half of Workers Are Likely to Search for a New Job in the Next 12 Months
|
pdf |
| 08/21/2024 |
Out-of-Network ATM Fees Hit Another Record, As Average Surcharge Sets 23rd Record High in Past 26 Years
|
pdf |
| 08/19/2024 |
Nearly a Third of Back-to-School Shoppers Say Inflation Will Change the Way They Shop This Year
|
pdf |
| 08/13/2024 |
The Hidden Costs of Owning a Car Can Add Up to Nearly $7,000 Annually in the U.S.
|
pdf |
| 08/07/2024 |
Home Improvements and Debt Consolidation Are Top Reasons to Tap Home Equity
|
pdf |
| 08/05/2024 |
Half of Credit Cardholders Are Carrying Credit Card Debt, and 61 Million Have Been in Debt for at Least a Year
|
pdf |
| 07/24/2024 |
Lock-In Effect Unlikely to Ease Soon: 47% of Homeowners Say Mortgage Rates Need to Be Below 5% for Them to Be Comfortable Buying a Home This Year
|
pdf |
| 07/22/2024 |
Delaware is the Best State to Retire; Alaska is the Worst
|
pdf |
| 07/17/2024 |
43% of Americans Say Their Finances Have Gotten Worse Under the Biden Administration
|
pdf |
| 07/15/2024 |
More Than 1 in 3 Workers Say They Are Living Paycheck to Paycheck On Their Current Salary
|
pdf |
| 07/10/2024 |
More Than One in Three Have a Side Hustle
|
pdf |
| 07/01/2024 |
The Average American Feels They Would Need to Earn $186K to Feel Financially Secure
|
pdf |
| 06/26/2024 |
The Motherhood Penalty: Fathers Earned 31% More in Annual Wages Than Mothers in 2023
|
pdf |
| 06/20/2024 |
Nearly 3 in 5 Americans Are Uncomfortable With Their Emergency Savings
|
pdf |
| 06/17/2024 |
Nearly 1 In 5 Americans Say Student Loan Debt Will Have A Major Influence On Their Vote In The 2024 Election
|
pdf |
| 06/10/2024 |
Hidden Costs of Homeownership For a Typical Single-Family Home Total Over $18,000 Per Year
|
pdf |
| 06/05/2024 |
59% Have a Negative View About Tipping, with 35% Saying Tipping Culture Has Gotten Out of Control
|
pdf |
| 05/30/2024 |
61% of Parents with Adult Children Have Sacrificed to Help Them Financially
|
pdf |
| 05/28/2024 |
About 1 in 5 Homeowners Have Taken On Debt to Cover Home Maintenance and Other Hidden Costs
|
pdf |
| 05/22/2024 |
Nearly Half of Current Homeowners Have at Least One Regret Related to Their Purchase
|
pdf |
| 05/20/2024 |
89% of Americans Do Not Consider Themselves Financially Successful, and 27% Never Think They Will Be
|
pdf |
| 05/16/2024 |
2 in 5 Millennials Have Purchased a Home Alone, Significantly More Than Older Generations
|
pdf |
| 04/29/2024 |
Renting is Now Cheaper Than Buying in All 50 of the Largest U.S. Metros
|
pdf |
| 04/24/2024 |
Homeownership Still Dominates the American Dream, but Affordability Remains the Major Obstacle
|
pdf |
| 04/22/2024 |
36% of Those Planning Summer Vacations Willing to Go Into Debt For Their Travels
|
pdf |
| 04/11/2024 |
Over Half of Buy Now, Pay Later Users Have Experienced at Least One Problem
|
pdf |
| 04/01/2024 |
Americans Need a Six-Figure Salary to Afford a Median-Priced Home in Nearly Half of U.S. States
|
pdf |
| 03/27/2024 |
Two-Thirds of Savers Still Earning a Rate of Return of Less Than 4%
|
pdf |
| 03/25/2024 |
Louisiana Has Highest Credit Card Debt Burden
|
pdf |
| 03/04/2024 |
Half of Loan Applicants Denied Since Federal Reserve Began Raising Rates
|
pdf |
| 02/29/2024 |
Americans Choose Boosting Savings Over Debt Payoff with Tax Refunds
|
pdf |
| 02/26/2024 |
More Than Half of Aspiring Homeowners Cite Cost of Living, Insufficient Income as Roadblocks
|
pdf |
| 02/22/2024 |
Americans With More Credit Card Debt Than Emergency Savings Remains at All-Time High
|
pdf |
| 02/05/2024 |
National Average Cost for Car Insurance Skyrockets 26% From Last Year, Averaging $2,543
|
pdf |
| 01/24/2024 |
Just 44% of Americans Say They Can Afford a $1,000 Emergency Expense From Their Savings
|
pdf |
| 01/22/2024 |
More Than 2 in 5 Americans In Live-In Relationships Have Committed Financial Infidelity
|
pdf |
| 01/08/2024 |
More Cardholders Are Carrying Credit Card Debt, and 56 Million Have Been in Debt for at Least a Year
|
pdf |
| 12/18/2023 |
Nearly Two-Thirds of Americans Do Not Expect Their Personal Finances to Improve in 2024
|
pdf |
| 12/04/2023 |
Holiday Tipflation: Americans Plan to Increase Annual Holiday Tip Amounts This Year Compared to 2022
|
pdf |
| 11/29/2023 |
3 in 5 Workers Say Pay is Not Keeping Up With Inflation, Up From 55% Last Year
|
pdf |
| 11/13/2023 |
Consumers Favor Small Business Saturday Over Black Friday, As More Plan to Shop Small This Holiday Season
|
pdf |
| 11/08/2023 |
Half of Americans Say Their Overall Financial Situation is Worse Since the 2020 Election
|
pdf |
| 11/06/2023 |
Best and Worst Cities for Local Holiday Shoppers
|
pdf |
| 10/25/2023 |
81% Did Not Increase Their Emergency Savings This Year, As Majority Feel Behind
|
pdf |
| 10/23/2023 |
Average Retail Credit Card APR Hits Record High of 28.93%
|
pdf |
| 10/16/2023 |
77% of Holiday Travelers Modify Plans Due to Inflation, Although More Plan to Travel
|
pdf |
| 10/02/2023 |
Extreme Weather Has Impacted Majority of Americans’ Wallets
|
pdf |
| 09/27/2023 |
56% of Workers Feel Behind on Retirement Savings
|
pdf |
| 09/18/2023 |
Americans Spent $71 Billion in Past 12 Months on Social Media Impulse Buys
|
pdf |
| 09/11/2023 |
Half of Holiday Shoppers to Begin by Halloween
|
pdf |
| 09/05/2023 |
78% of Those Who Hold the 20 Most Lucrative College Degrees are Men
|
pdf |
| 08/30/2023 |
ATM Fees Hit Record High; Overdraft and NSF Fees Down Sharply
|
pdf |
| 08/23/2023 |
89% of Workers Prefer Four-Day Work Week, Remote Work or Hybrid Work; Over Half Willing to Switch Jobs
|
pdf |
| 08/17/2023 |
Nearly Half of Borrowers Believe Student Loan Debt is a National Crisis and the Government Hasn't Done Enough
|
pdf |
| 08/07/2023 |
54 Million U.S. Adults Have Been in Credit Card Debt for at Least a Year
|
pdf |
| 07/31/2023 |
Iowa is the Best State to Retire; Alaska is the Worst
|
pdf |
| 07/24/2023 |
Nearly Half of US Adults Have at Least One Unused Gift Card; Average Amount is $187
|
pdf |
| 07/19/2023 |
Nearly Three-Quarters of Americans Have a Financial Regret, Most Commonly Not Saving for Retirement Early Enough
|
pdf |
| 07/10/2023 |
77% of Travelers Experienced Issues This Year; More than Half Cited Higher Prices
|
pdf |
| 06/26/2023 |
Austin, TX, is the Best City to Launch a Career; Riverside, CA, is the Worst
|
pdf |
| 06/22/2023 |
Majority Uncomfortable with Their Emergency Savings as Fewer than Half Have 3 Months' Expenses Saved
|
pdf |
| 06/08/2023 |
Two-Thirds Have a Negative View About Tipping, as Americans Tip Less Often
|
pdf |
| 05/24/2023 |
Nearly 2 in 5 Have a Side Hustle; 44% Think They Will Always Need One
|
pdf |
| 05/22/2023 |
Southeastern U.S. Sweeps Top 10 Hottest Housing Markets
|
pdf |
| 05/17/2023 |
More Than Half of Investors Took Action This Year Due to Inflation, Better Safe Haven Returns
|
pdf |
| 05/08/2023 |
52% of U.S. Adults Say Money Has a Negative Impact on Their Mental Health, up from 42% in 2022
|
pdf |
| 04/26/2023 |
80% of Summer Vacationers Are Making Changes Due to Inflation
|
pdf |
| 04/19/2023 |
73% of Aspiring Homeowners Cite an Affordability Factor as the Primary Obstacle
|
pdf |
| 04/10/2023 |
68% Have Made a Financial Sacrifice to Help Adult Children
|
pdf |
| 04/03/2023 |
More Than Half of Workforce Likely to Look for a New Job in Next 12 Months, Up from Last Year
|
pdf |
| 03/30/2023 |
Less Than 1 in 4 Savers Earning at Least 3%; 75% of Online Accounts Offer Rates Higher Than That
|
pdf |
| 03/27/2023 |
The Average Gen Z and Millennial Wedding Guest Will Spend Around $1,200 Attending Weddings This Year
|
pdf |
| 03/01/2023 |
Nearly 7 in 10 Are Worried About Their Tax Refunds Due to Inflation, Smaller Payouts and More
|
pdf |
| 02/27/2023 |
Austin, TX, is the Best Metro for First-Time Homebuyers; Washington, D.C., is the Worst
|
pdf |
| 02/23/2023 |
Nearly Half Have Less or No Savings Compared to a Year Ago
|
pdf |
| 02/09/2023 |
Nearly 2 in 5 In Relationships Have Committed Financial Infidelity and More Than Half Believe it’s at Least as Bad as Physical Cheating
|
pdf |
| 02/06/2023 |
The Average Cost of Auto Insurance in the U.S. is $2,014 in 2023, Up 13.72% from Last Year
|
pdf |
| 01/25/2023 |
Majority Unable to Afford $1,000 Emergency Expense as Inflation Increasingly Stifles Ability to Save
|
pdf |
| 01/17/2023 |
57 Million Pay Checking Account Fees Every Month and Nearly Half are Sacrificing Recession Preparedness to Do So
|
pdf |
| 01/10/2023 |
More Cardholders are Now Carrying Credit Card Debt and More Than 2 in 5 with Debt Don’t Know Their Interest Rates
|
pdf |
| 12/19/2022 |
Nearly 2 in 3 Americans Do Not Expect Personal Finances to Improve in 2023
|
pdf |
| 12/07/2022 |
More Adults Plan to Give Annual Holiday Tips This Year Compared to 2021, But Will Likely Give Lower Amounts
|
pdf |
| 11/21/2022 |
More Consumers Likely to Shop on Small Business Saturday than Black Friday this Year
|
pdf |
| 11/17/2022 |
Majority of Americans Delaying Financial Milestones, Opting Out of Activities or Events Due to State of the Economy
|
pdf |
| 10/31/2022 |
43% Say Their Finances Are Worse Now Than When Biden Was Elected
|
pdf |
| 10/24/2022 |
More Than One Third of Working Americans Feel They are “Significantly Behind” on Retirement Savings
|
pdf |
| 10/05/2022 |
Inflation, Rising Prices Causing 79% of Holiday Travelers to Change Their Plans
|
pdf |
| 09/14/2022 |
Majority of American Households: “Pay Not Keeping Up with Inflation”
|
pdf |
| 09/08/2022 |
Half of Holiday Shoppers to Begin by Halloween With Inflation Set to Play Major Role
|
pdf |
| 08/31/2022 |
Costly Overdraft & NSF Fees Still Charged by Majority of Banks
|
pdf |
| 08/24/2022 |
Roughly 7 in 10 are Worried About Possible Recession, Taking Steps to Prepare
|
pdf |
| 08/18/2022 |
Michigan the Most Affordable State for Retirees, Florida is the Best Overall
|
pdf |
| 08/11/2022 |
41% of Back-to-School Shoppers Will Change the Way They Shop Due to Inflation, with 95% of Those Actively Looking to Save Money This Year
|
pdf |
| 07/20/2022 |
Real Estate Still Americans’ Preferred Long-term Investment
|
pdf |
| 07/18/2022 |
Nearly Half of Gen Z, Millennial Social Media Users Have Felt Negatively About Their Finances After Seeing Others’ Posts
|
pdf |
| 07/11/2022 |
Nearly 4 in 5 Travelers Have Experienced Issues This Year
|
pdf |
| 06/23/2022 |
Majority Now Uncomfortable With Emergency Savings as More Balances Have Declined in Past Year
|
pdf |
| 06/21/2022 |
Side Gig Income Becomes More Critical: 41% Need it for Living Expenses, up from 31% in 2019
|
pdf |
| 06/13/2022 |
Los Angeles is the Worst Metro for First-Time Homebuyers; Pittsburgh is the Best
|
pdf |
| 05/19/2022 |
Amid Market Volatility and Inflation, Less than 1 in 5 Will Increase Their Stock Market Investments This Year
|
pdf |
| 05/02/2022 |
42% of U.S. Adults Say Money Negatively Impacts Their Mental Health
|
pdf |
| 04/25/2022 |
69% of Summer Vacationers Anticipate Making Changes Due to Inflation
|
pdf |
| 04/21/2022 |
Roughly 7 in 10 Gen Z, Millennial Student Loan Borrowers Delayed a Major Financial Decision as a Result of This Debt
|
pdf |
| 04/04/2022 |
The Average Cost of Auto Insurance in the U.S. is $1,771 in 2022
|
pdf |
| 03/30/2022 |
Nearly Two-Thirds Say Affordability Factors are Holding Them Back From Homeownership
|
pdf |
| 03/14/2022 |
Over Half of Workforce Still Likely to Look for New Job in Next 12 Months
|
pdf |
| 03/09/2022 |
Roughly 3 in 4 Say Inflation is Hurting Them Financially, Are Worried About Further Price Increases
|
pdf |
| 02/22/2022 |
Concerns of Delays, Inflation, and More Have Two-Thirds Worried About Their Tax Refunds This Year
|
pdf |
| 02/09/2022 |
Just 53% of Americans Have More Emergency Savings Than Credit Card Debt
|
pdf |
| 02/07/2022 |
51% of U.S. Adults with a Subscription or Membership Account Have Incurred Unwanted Charges
|
pdf |
| 01/19/2022 |
Just 44% of Americans Could Cover an Unplanned $1,000 Expense From Savings
|
pdf |
| 01/10/2022 |
40% of Credit Card Debtors Don’t Know Their Interest Rate
|
pdf |
| 01/04/2022 |
Gen Z and Millennials Paying More Than Three Times as Much in Monthly Checking Account Fees as Older Generations
|
pdf |
| 12/20/2021 |
2 in 3 U.S. Adults Do Not Expect Personal Finances to Improve in 2022
|
pdf |
| 12/13/2021 |
Over 4 in 10 Who Extended Financial Assistance to Friends and Family Suffered Consequences
|
pdf |
| 12/06/2021 |
69% With Federal Student Loans Will Need to Take Additional Action to Afford Monthly Payments When Deferment Ends Next Year
|
pdf |
| 11/22/2021 |
77% of U.S. Adults Experienced Product-Related Shopping Problems in October
|
pdf |
| 11/17/2021 |
52% of Workers Feel Behind on Retirement Savings
|
pdf |
| 11/15/2021 |
California Ranks as Worst State for Drivers, Ohio is the Best
|
pdf |
| 10/27/2021 |
Majority of Workers (56%) Haven’t Received a Pay Raise or Promotion in the Past Year
|
pdf |
| 10/25/2021 |
More Adults Likely to Attend a Live Event or Attraction in Q4 Than Q1, Q2, Q3 Combined
|
pdf |
| 10/20/2021 |
Overdraft Fees Hit All Time High, Interest Checking Account Balance Requirements Soar
|
pdf |
| 10/04/2021 |
Ranking the Most and Least Valuable College Majors
|
pdf |
| 09/27/2021 |
59 Million Added to Credit Card Debt Since Beginning of COVID-19 Pandemic
|
pdf |
| 09/20/2021 |
Three California Metros Top the List of Most Expensive Places to Insure a Teen Driver
|
pdf |
| 09/15/2021 |
Americans Say Biggest Threat to the Economy Continues to be the Covid-19 Pandemic
|
pdf |
| 08/25/2021 |
Higher Prices: Nearly Two-Thirds Say Increases Have Had Negative Financial Impact
|
pdf |
| 08/23/2021 |
55% of Those in the Workforce Likely to Search for a New Job in the Next 12 Months
|
pdf |
| 08/18/2021 |
Despite Record Low Rates, Less Than 1 in 5 With Pre-Pandemic Mortgages Have Refinanced
|
pdf |
| 07/26/2021 |
U.S. Adults Total $15 Billion in Unused Gift Cards, Vouchers, Store Credits
|
pdf |
| 07/21/2021 |
More Than Half Have Less Than 3 Months’ Emergency Savings
|
pdf |
| 07/07/2021 |
Georgia Beats Out Florida, Emerges as #1 Best State to Retire in 2021
|
pdf |
| 06/23/2021 |
Real Estate and Cash Are Americans’ Top Preferred Investments Over the Next 10 Years
|
pdf |
| 06/22/2021 |
As Workers Return to Office, Majority Say Working From Home Improved Their Finances
|
pdf |
| 05/19/2021 |
Many Parents Forced to Alter Work Schedules to Care for Children During Pandemic, Take on Debt for Summer Childcare
|
pdf |
| 05/17/2021 |
64% of Millennial Homeowners Have Regrets: Maintenance and Hidden Costs Biggest Culprit
|
pdf |
| 05/12/2021 |
Lasting Pandemic Effect – Americans Vow to Save More for Emergencies
|
pdf |
| 04/19/2021 |
Just 16% Have a Ticket to a Future Live Event
|
pdf |
| 04/14/2021 |
67% Receiving Stimulus Payment Say It’s Important to Their Near-term Financial Situation
|
pdf |
| 04/07/2021 |
Millennials, Gen Z More Than Twice as Likely to Have Delayed a Financial Milestone Due to COVID-19 Pandemic
|
pdf |
| 03/31/2021 |
2021 Annual Auto Insurance Premiums Average $1,674/year in the U.S.
|
pdf |
| 03/24/2021 |
More Than Half of Investors Think the Stock Market is Rigged Against the Individual
|
pdf |
| 03/22/2021 |
While Many Parents Cite Benefits of Remote Learning, Men and Women See It Differently
|
pdf |
| 03/15/2021 |
31% of Young Adults Relocated During the Pandemic
|
pdf |
| 03/03/2021 |
Housing Markets in Mountain West, Midwest Hottest Through End of 2020
|
pdf |
| 02/24/2021 |
Even after COVID-19 Vaccination, Nearly a Quarter of U.S. Adults (24%) Won’t Be Comfortable Visiting Local Businesses
|
pdf |
| 02/22/2021 |
31% of Rewards Cardholders Didn’t Redeem Any Points, Miles or Stays in 2020
|
pdf |
| 02/10/2021 |
Barely Half Have More Emergency Savings Than Credit Card Debt
|
pdf |
| 01/19/2021 |
71% of Recipients Say Stimulus Money Important to Near-Term Financial Situation, But Relief Won’t Last Long
|
pdf |
| 01/13/2021 |
Those Financially Impacted by COVID-19 Paying Four Times More in Bank Fees
|
pdf |
| 01/11/2021 |
Less Than 4-in-10 Could Pay an Unexpected $1,000 Expense Out of Savings
|
pdf |
| 12/21/2020 |
Even in 2020, It’s Still Easy to Get Out of Credit Card Fees If You Ask
|
pdf |
| 12/14/2020 |
48% With Homeowners Insurance, 38% With Auto Insurance Who Didn’t Review Their Policies This Year Should Have
|
pdf |
| 12/09/2020 |
42% of Households Say Income is Below Pre-Pandemic Levels Because of COVID-19 Impact
|
pdf |
| 11/23/2020 |
Nearly 1 in 3 Millennials Have Been Denied A Financial Product This Year Due to Credit Score
|
pdf |
| 11/16/2020 |
27% of Mortgage Holders Don’t Know Their Interest Rate
|
pdf |
| 10/28/2020 |
Over 9 in 10 Put Their Personal Data at Risk as Online Holiday Shopping Expected to Rise
|
pdf |
| 10/21/2020 |
Interest Checking Account Fees Hit Record High, Average Yield Ties Record Low
|
pdf |
| 10/14/2020 |
More Say Coronavirus Pandemic, Not Election Outcome, is the Biggest Threat to the Economy
|
pdf |
| 10/07/2020 |
61% of Property Insurance Policyholders: “I’m Not Very Confident I Know My Deductible”
|
pdf |
| 09/23/2020 |
Nearly Half Say Top Financial Priority Is ‘Getting Caught Up or Staying Current on Bills’
|
pdf |
| 09/08/2020 |
Just Over One Quarter Say Finances Have Improved Under President Trump
|
pdf |
| 09/02/2020 |
75% of Millennial Homeowners Will Spend Big on Upgrades This Year, But Nearly Half Will Go into Debt to Do So
|
pdf |
| 08/20/2020 |
Nearly 3x Americans Report Having Less, Versus More, Emergency Savings Now Than Before the Pandemic
|
pdf |
| 08/19/2020 |
More Than Half Have Lost Money on Their Canceled Events Due to Covid-19
|
pdf |
| 08/13/2020 |
More Than 3 in 5 Parents Say Remote Learning Would Negatively Impact Their Finances
|
pdf |
| 07/23/2020 |
Americans Now Point to Stock Market as Favorite Long-Term Investment
|
pdf |
| 07/22/2020 |
33% of Cardholders Did Something That Could Hurt Their Credit Score During COVID-19
|
pdf |
| 07/15/2020 |
More Than One-Third Delayed a Major Financial Milestone Due to COVID-19
|
pdf |
| 07/09/2020 |
Nearly Half of U.S. Households: Income Declined Due to Covid-19
|
pdf |
| 06/24/2020 |
Fewer People Losing Sleep Over Money Issues Right Now
|
pdf |
| 06/18/2020 |
More Than Half Regret Their Emergency, Retirement Savings Concerning the Pandemic
|
pdf |
| 06/15/2020 |
Nearly Three-Quarters’ Personal Finances Have Not Improved Since President Trump Took Over
|
pdf |
| 05/27/2020 |
31 Million Have Withdrawn, Plan to Withdraw from Retirement Savings Due to COVID-19
|
pdf |
| 05/18/2020 |
Only 35% Comfortable Visiting Local Businesses in Under a Month if Reopened by Memorial Day
|
pdf |
| 05/14/2020 |
Credit Card Usage Soars at Grocery Stores, Restaurants During Coronavirus Pandemic
|
pdf |
| 05/13/2020 |
Nearly 1 in 5 Has Diminished Savings Since Start of Coronavirus
|
pdf |
| 05/06/2020 |
More than Half of Mortgage, Auto Borrowers Are Concerned About Making Upcoming Payments
|
pdf |
| 04/27/2020 |
Growing Concern Among U.S. Adults About Paying Bills, Value of Investments Even as Stimulus Checks Go Out
|
pdf |
| 04/16/2020 |
59 Million Have Lost Money on Canceled Plans Due to Coronavirus
|
pdf |
| 04/14/2020 |
U.S. Adults Less Concerned About Paying Bills Since Stimulus Package Announced
|
pdf |
| 04/08/2020 |
31% Think Stimulus Checks Won’t Sustain Them for One Month
|
pdf |
| 03/31/2020 |
Majority Have Cut Spending Amid Coronavirus Crisis
|
pdf |
| 03/19/2020 |
64% of Millennials Have Used Someone Else’s Subscription Service
|
pdf |
| 03/12/2020 |
Nearly 1 in 3 Families Skipped Medical Care in Past Year Due to Cost
|
pdf |
| 03/11/2020 |
More Than Three-Quarters Say Their Mortgage Negatively Impacts Their Ability to Save Money
|
pdf |
| 02/20/2020 |
Just 49% Have More Emergency Savings than Credit Card Debt
|
pdf |
| 02/18/2020 |
U.S. Adults Have More Than $20 Billion in Unused Gift Cards or Other Leftover Credits
|
pdf |
| 02/13/2020 |
More Than 1 in 4 Do Not Know Their Mortgage Rate
|
pdf |
| 02/10/2020 |
Millennials Have High Valentine’s Day Expectations
|
pdf |
| 01/23/2020 |
More Than Half of Rewards Cardholders Are Missing Out on Rewards
|
pdf |
| 01/22/2020 |
Only 4 in 10 Could Pay an Unexpected $1,000 Expense From Their Savings
|
pdf |
| 01/16/2020 |
Most Americans Don’t Expect Finances to Improve This Year
|
pdf |
| 01/15/2020 |
Minorities, Millennials Among Those Who Pay the Most Bank Fees
|
pdf |
| 12/19/2019 |
Half of Workers Did Not Get a Pay Increase This Year
|
pdf |
| 12/18/2019 |
46% of Americans With $100k or more in Net Worth Struggle with Credit Card Debt
|
pdf |
| 12/12/2019 |
Lowest Earners Spend Disproportionately on Lottery Tickets, Other Financial Vices
|
pdf |
| 11/25/2019 |
Most Americans Expect to Spend the Same or Less This Holiday Season
|
pdf |
| 11/21/2019 |
More than Half of American Workers are Behind on Their Retirement Savings
|
pdf |
| 11/20/2019 |
Only 35% Owe Less on Credit Cards Relative to Past Decade
|
pdf |
| 11/13/2019 |
38 Million Willing to Boycott Holiday Gift-Giving to Save Money
|
pdf |
| 10/24/2019 |
Despite Safety Concerns 64% of U.S. Debit or Credit Cardholders Save Their Information Online
|
pdf |
| 10/23/2019 |
67% Say Finances Have Not Improved Since Last Election
|
pdf |
| 10/16/2019 |
4 in 10 are Not Prepared for a Recession
|
pdf |
| 10/02/2019 |
Out-of-Network ATM Withdrawals Cost More Than Ever
|
pdf |
| 09/26/2019 |
Just Under Half of Those Who Lent Cash to Friends and Family Suffered Consequences
|
pdf |
| 09/25/2019 |
America’s Top Financial Priority is Simply Keeping up With Bills
|
pdf |
| 09/11/2019 |
High Cost of Living, Student Loan Debt Force Determined Millennial Homebuyers to Get Creative
|
pdf |
| 08/28/2019 |
58% of Millennials Have Been Denied At Least One Financial Product Because of Their Credit Score
|
pdf |
| 08/26/2019 |
Ranking: The Most and Least Valuable College Majors
|
pdf |
| 08/21/2019 |
Only 29% of Working Americans Have Increased Their Retirement Savings Contributions
|
pdf |
| 08/14/2019 |
68% of Americans Have Skipped Recreational Activities in the Past Year Due to The Cost
|
pdf |
| 07/29/2019 |
Parents: Back-to-School Shopping Nearly as Daunting as the Holidays
|
pdf |
| 07/17/2019 |
Real Estate Remains Americans’ Preferred Long-Term Investment
|
pdf |
| 07/10/2019 |
Nebraska is the Best State to Retire
|
pdf |
| 06/27/2019 |
More Than Half of Americans Lose Sleep Over Money
|
pdf |
| 06/26/2019 |
4 in 10 Say Economy is Weak — Experts Unanimously Disagree
|
pdf |
| 06/20/2019 |
1 in 3 Will Accrue Credit Card Debt from Summer Childcare Expenses
|
pdf |
| 06/13/2019 |
47 Million Are Worse Off Now Than Before the Great Recession
|
pdf |
| 06/05/2019 |
Nearly Half of U.S. Workers Have a Side Hustle
|
pdf |
| 05/30/2019 |
129 Million Don’t Realize Negative Impacts of Cancelling Credit Cards
|
pdf |
| 05/29/2019 |
America’s Top Financial Regret is Failure to Save
|
pdf |
| 05/23/2019 |
7 in 10 Americans Earn Less Than 2% APY on Savings
|
pdf |
| 05/13/2019 |
The Best and Worst Metros to Build an Emergency Fund
|
pdf |
| 04/25/2019 |
39 Million Can’t Afford a Summer Vacation
|
pdf |
| 04/24/2019 |
50% Sacrifice Retirement Savings to Financially Support Adult Children
|
pdf |
| 04/17/2019 |
Americans Three Times as Likely to Single Out Politics as Biggest Economic Threat
|
pdf |
| 04/11/2019 |
Millennials Redefine First-Date Finances
|
pdf |
| 04/01/2019 |
30% Who Declined a Wedding Invite Due to Cost Were Negatively Impacted
|
pdf |
| 03/18/2019 |
San Francisco is the Worst Metro for First-Time Homebuyers
|
pdf |
| 03/14/2019 |
21% of Working Americans Aren’t Saving Anything at All
|
pdf |
| 02/28/2019 |
63% of Millennial Homeowners Have Buyer’s Remorse
|
pdf |
| 02/27/2019 |
73% of Millennials with Student Loan Debt Have Delayed a Major Milestone as a Result
|
pdf |
| 02/13/2019 |
74 Million Americans Have More Credit Card Debt Than Emergency Savings
|
pdf |
| 02/06/2019 |
Men Have Higher Expectations for Valentine’s Day
|
pdf |
| 01/16/2019 |
More than 1 in 3 Americans Would Go Into Debt to Pay a $1,000 Emergency Expense
|
pdf |
| 01/14/2019 |
Majority Don’t Think Their Finances Will Improve in 2019
|
pdf |
| 12/12/2018 |
6 in 10 Employed Americans Report No Salary Increase This Year
|
pdf |
| 12/05/2018 |
California Still the Worst State for Drivers, North Dakota is the Best
|
pdf |
| 11/28/2018 |
43% of Americans Say the Political Environment is the Biggest Threat to the U.S. Economy
|
pdf |
| 11/19/2018 |
45% of Americans Have Felt Pressured to Overspend on Holiday Gifts
|
pdf |
| 10/31/2018 |
Millennials, Baby Boomers Disagree About Sharing Salary Information
|
pdf |
| 10/24/2018 |
Majority of Americans Feel Their Finances Have Not Improved Since 2016 Election
|
pdf |
| 10/17/2018 |
66% of Americans are Limiting Spending
|
pdf |
| 10/10/2018 |
Banks Charge Non-Customers Record Amount to Use Their ATMs
|
pdf |
| 09/19/2018 |
24 Million Would Tap Home Equity to Keep up With Household Bills
|
pdf |
| 09/12/2018 |
Lowest Earners Spend 13% of Their Income on These Financial Vices
|
pdf |
| 09/10/2018 |
Ranking the Most and Least Valuable College Majors
|
pdf |
| 08/22/2018 |
More Americans Ramping Up Retirement Savings
|
pdf |
| 08/16/2018 |
Older Millennials Are the Most Stressed Age Group
|
pdf |
| 08/08/2018 |
America’s Growing Health Crisis for Women
|
pdf |
| 07/25/2018 |
Millennials Prefer Cash as Long-Term Investment
|
pdf |
| 07/18/2018 |
Americans Reveal Ideal Ages for Financial Milestones
|
pdf |
| 07/12/2018 |
South Dakota is the Best State to Retire
|
pdf |
| 06/25/2018 |
37% Have a Side Hustle
|
pdf |
| 06/20/2018 |
Many Americans are Satisfied with Their Inadequate Emergency Savings
|
pdf |
| 06/07/2018 |
6 in 10 Americans Don’t Know How Much Money They Need to Retire
|
pdf |
| 05/23/2018 |
1 in 4 Can’t Afford a Summer Vacation
|
pdf |
| 05/21/2018 |
Credit Unions Are Fee-Friendly Option for Consumers
|
pdf |
| 05/16/2018 |
49% Have Not Begun Addressing Their Biggest Financial Regret
|
pdf |
| 05/10/2018 |
Easiest and Hardest Metros to Build an Emergency Fund
|
pdf |
| 04/25/2018 |
62% of Homeowners Don’t Ever Plan to Move
|
pdf |
| 03/28/2018 |
How Much Should Guests Expect to Spend This Wedding Season?
|
pdf |
| 03/19/2018 |
Just Six Percent Were Net Sellers During Stock Market Correction
|
pdf |
| 03/14/2018 |
Despite Improving Economy, 1 in 5 Working Americans Aren’t Saving Any Money
|
pdf |
| 03/05/2018 |
Only 24% of US Workers are Aware of Changes in their Pay Check Due to Revisions in the Federal Tax Law
|
pdf |
| 02/22/2018 |
1 in 3 Does Not Have More Savings Than Credit Card Debt
|
pdf |
| 02/14/2018 |
Homeowners Spend Average of $2,000 Per Year on Maintenance Services
|
pdf |
| 02/08/2018 |
63% of Smartphone Users Have One or More Financial Apps
|
pdf |
| 02/01/2018 |
American Workers Report Strong Job Satisfaction
|
pdf |
| 01/18/2018 |
Just 39% of Americans Can Pay for a $1,000 Unexpected Expense
|
pdf |
| 12/26/2017 |
Just 23% Believe Elected Leaders Will Positively Impact Finances
|
pdf |
| 11/28/2017 |
Americans’ Favorite Ways to Give to Charity
|
pdf |
| 11/20/2017 |
Pittsburgh is the Best City to Retire
|
pdf |
| 11/14/2017 |
Majority of Americans Not Getting Salary Increases
|
pdf |
| 10/24/2017 |
Millennials More Than Twice as Likely to Limit Spending to Save More
|
pdf |
| 10/23/2017 |
Lowest-Income Americans Pay Three Times as Much for Checking Accounts
|
pdf |
| 10/02/2017 |
ATM Fees Set New Record; Up 55% in Past Decade
|
pdf |
| 09/28/2017 |
Bankrate: Mortgage Rates Show Little Change
|
pdf |
| 09/27/2017 |
Americans Fear D.C. Politics More than North Korea
|
pdf |
| 09/21/2017 |
Bankrate: Mortgage Rates Move Back Above 4 Percent
|
pdf |
| 09/18/2017 |
Nearly Half of Americans Plan to Make a Substantial Purchase This Year
|
pdf |
| 09/13/2017 |
Bankrate: Mortgage Rates Rebound Slightly
|
pdf |
| 09/07/2017 |
Bankrate: Mortgage Rates Dip for 3rd Consecutive Week
|
pdf |
| 08/31/2017 |
Bankrate: Mortgage Rates Set 2017 Low
|
pdf |
| 08/30/2017 |
Millions Have Already Booked Holiday Travel
|
pdf |
| 08/16/2017 |
Bankrate: Mortgage Rates Remain in Holding Pattern
|
pdf |
| 08/15/2017 |
Percentage of Working Americans Saving More for Retirement Highest in Six Years
|
pdf |
| 08/09/2017 |
Bankrate: Mortgage Rates Mostly Steady Amid Summer Doldrums
|
pdf |
| 08/03/2017 |
Bankrate: Mortgage Rates Fall for 4th Week in a Row
|
pdf |
| 07/27/2017 |
Bankrate: Mortgage Rates Inch Lower as Fed Holds Rates Steady
|
pdf |
| 07/20/2017 |
Millennial Spending Habits Differ From Older Generations
|
pdf |
| 07/20/2017 |
Bankrate: Mortgage Rates Retreat for Second Week in a Row
|
pdf |
| 07/19/2017 |
Real Estate is Americans’ Favorite Long-Term Investment
|
pdf |
| 07/13/2017 |
Bankrate: Mortgage Rates Move Lower
|
pdf |
| 07/12/2017 |
Over 44 Million Americans Have a Side Hustle
|
pdf |
| 07/06/2017 |
Bankrate: Mortgage Rates Continue to Rise
|
pdf |
| 06/29/2017 |
Bankrate: Mortgage Rates Inch Higher
|
pdf |
| 06/28/2017 |
New Cars Unaffordable for Most Americans
|
pdf |
| 06/26/2017 |
Millennials Struggle with Financial Vices
|
pdf |
| 06/22/2017 |
Bankrate: Mortgage Rates Nudge Higher, But Remain Near 7-Month Lows
|
pdf |
| 06/20/2017 |
Nearly 1 in 4 Has No Emergency Savings
|
pdf |
| 06/15/2017 |
Bankrate: Mortgage Rates Hovering at 7-Month Lows
|
pdf |
| 06/08/2017 |
Bankrate: Mortgage Rates Hit 7-Month Low
|
pdf |
| 06/07/2017 |
1-in-4 American Families Have Not Sought Medical Attention Due to Cost
|
pdf |
| 06/01/2017 |
Bankrate: Mortgage Rates At Lowest Since Mid-November
|
pdf |
| 05/25/2017 |
Bankrate: Mortgage Rates Hit Six-Month Low
|
pdf |
| 05/25/2017 |
Houston is the Best City to Start a Career
|
pdf |
| 05/23/2017 |
73% Have Financial Regrets
|
pdf |
| 05/18/2017 |
Bankrate: Mortgage Rates Slide to 5-Month Low
|
pdf |
| 05/17/2017 |
Millennials Think Parents Should Stop Helping with Bills at Earlier Ages
|
pdf |
| 05/11/2017 |
Bankrate: Mortgage Rates Rebound Slightly
|
pdf |
| 05/10/2017 |
42% of Americans Say a Person’s Credit Score Affects Romantic Interest
|
pdf |
| 05/04/2017 |
Bankrate: Mortgage Rates Dawdle Leading Up to Fed Announcement
|
pdf |
| 04/27/2017 |
Bankrate: Mortgage Rates Show Slight Rebound
|
pdf |
| 04/24/2017 |
Political Climate is Biggest Economic Risk
|
pdf |
| 04/20/2017 |
Bankrate: Mortgage Rates Drop to 2017 Lows
|
pdf |
| 04/19/2017 |
Wedding Gift-Giving Tendencies Vary by Region
|
pdf |
| 04/13/2017 |
Bankrate: Mortgage Rates Slip Amid Geopolitical Tensions
|
pdf |
| 04/12/2017 |
3 in 10 Have Never Redeemed Credit Card Rewards
|
pdf |
| 04/06/2017 |
Bankrate: Mortgage Rates Lowest Since Mid-January
|
pdf |
| 03/30/2017 |
Bankrate: Mortgage Rates Show Little Change
|
pdf |
| 03/29/2017 |
Best and Worst States to Retire
|
pdf |
| 03/23/2017 |
Bankrate: Mortgage Rates Reverse Course
|
pdf |
| 03/21/2017 |
Americans Feel Better About Savings for First Time in Six Years
|
pdf |
| 03/16/2017 |
Mortgage Rates Hit Multi-Year Highs Ahead of Fed Meeting
|
pdf |
| 03/13/2017 |
Free Checking Reaches New High at Credit Unions
|
pdf |
| 03/09/2017 |
Bankrate: Mortgage Rates Jump to Nearly 3-Year High
|
pdf |
| 03/06/2017 |
Just 6% Plan to Splurge with Their Tax Refund
|
pdf |
| 03/02/2017 |
Bankrate: Mortgage Rates Rebound Following President’s Speech
|
pdf |
| 02/28/2017 |
California the Toughest State for First-Time Homebuyers
|
pdf |
| 02/23/2017 |
Bankrate: Mortgage Rates Slide Back
|
pdf |
| 02/22/2017 |
Americans Losing Ground in the Battle between Debt & Savings
|
pdf |
| 02/17/2017 |
Bankrate: Mortgage Rates Bound Higher on Inflation Pickup
|
pdf |
| 02/09/2017 |
Americans Overoptimistic About Homeownership This Year
|
pdf |
| 02/09/2017 |
Bankrate: Mortgage Rates Pull Back on Political Uncertainty
|
pdf |
| 02/02/2017 |
Bankrate: Mortgage Rates Slightly Changed as Fed Holds Steady
|
pdf |
| 01/26/2017 |
Bankrate: Mortgage Rates Return to Highest Level in More than 2 Years
|
pdf |
| 01/24/2017 |
Fears Grow Over Rising Interest Rates
|
pdf |
| 01/19/2017 |
Bankrate: Mortgage Rates Fall for 3rd Consecutive Week
|
pdf |
| 01/12/2017 |
Nearly 60% of Americans Can’t Afford Common Unexpected Expenses
|
pdf |
| 01/05/2017 |
Bankrate: Mortgage Rates Slide to Start 2017
|
pdf |
| 12/29/2016 |
Bankrate: Mortgage Rates Notch Higher for 9th Consecutive Week
|
pdf |
| 12/22/2016 |
Bankrate: Mortgage Rates Hit 27-Month High
|
pdf |
| 12/19/2016 |
52% of Working Americans Will Give Up Vacation Days this Year
|
pdf |
| 12/15/2016 |
Bankrate: Mortgage Rates Continue to Climb
|
pdf |
| 12/13/2016 |
Iowa is the #1 State for Drivers, California is Last
|
pdf |
| 12/08/2016 |
Bankrate: Mortgage Rates Continue to March Higher
|
pdf |
| 12/08/2016 |
Americans Divided on Financial Impact of the Presidential Election
|
pdf |
| 12/01/2016 |
Bankrate: Mortgage Rates Continue to Rise
|
pdf |
| 11/23/2016 |
Bankrate: Mortgage Rates Highest Since Early January
|
pdf |
| 11/22/2016 |
Less Than 1-in-4 Americans Plan for In-Store Shopping on Black Friday
|
pdf |
| 11/16/2016 |
Bankrate: Mortgage Rates Show Biggest Weekly Increase Since June 2013
|
pdf |
| 11/15/2016 |
48% of Americans Have Seen Their Pay Increase over the Past Year
|
pdf |
| 11/10/2016 |
Americans are Divided on Holiday Gift Preferences
|
pdf |
| 11/09/2016 |
Bankrate: Mortgage Rates Spike After Trump Victory
|
pdf |
| 11/03/2016 |
Bankrate: Mortgage Rates Inch Higher
|
pdf |
| 10/26/2016 |
Bankrate: Mortgage Rates Mostly Unchanged
|
pdf |
| 10/24/2016 |
Best/Worst Metro Areas for Building Wealth
|
pdf |
| 10/20/2016 |
Bankrate: Mortgage Rates Show Little Movement
|
pdf |
| 10/18/2016 |
65% of Americans are Limiting Their Monthly Spending
|
pdf |
| 10/12/2016 |
Bankrate: Mortgage Rates Jump to 4-Week High
|
pdf |
| 10/11/2016 |
41 Million Americans Have Had Identities Stolen
|
pdf |
| 10/06/2016 |
Bankrate: Mortgage Rates Notch Higher
|
pdf |
| 10/04/2016 |
ATM Fees Set New Record High; Overdraft Fees Are Down
|
pdf |
| 09/29/2016 |
Bankrate: Mortgage Rates Fall to Nearly 3-Month Lows
|
pdf |
| 09/22/2016 |
Bankrate: Mortgage Rates Down Slightly
|
pdf |
| 09/15/2016 |
Bankrate: Fed Fears Drive Rates to 3-Month High
|
pdf |
| 09/13/2016 |
Americans Say the Presidential Election is the Biggest Threat to the U.S. Economy
|
pdf |
| 09/08/2016 |
Bankrate: Mortgage Rates Stay the Course
|
pdf |
| 09/07/2016 |
7 in 10 Americans Plan on Working during Retirement
|
pdf |
| 09/01/2016 |
Bankrate: Mortgage Rates in Summer Doldrums
|
pdf |
| 08/31/2016 |
Best and Worst Metro Areas for Homeowners
|
pdf |
| 08/25/2016 |
Bankrate: Mortgage Rates Show Little Change
|
pdf |
| 08/18/2016 |
Bankrate: Mortgage Rates in Holding Pattern
|
pdf |
| 08/16/2016 |
31 Million American Workers Are Saving More for Retirement
|
pdf |
| 08/11/2016 |
Bankrate: Mortgage Rates Remain at 2nd Lowest Level of 2016
|
pdf |
| 08/09/2016 |
Hawaii Has the Highest Closing Costs, Pennsylvania Has the Lowest
|
pdf |
| 08/04/2016 |
Bankrate: Mortgage Rates Slump on News of Disappointing Economic Growth
|
pdf |
| 08/01/2016 |
Nearly 9 in 10 College Graduates Say College is a Good Investment
|
pdf |
| 07/28/2016 |
Bankrate: Mortgage Rates Continue Post-Brexit Rebound
|
pdf |
| 07/21/2016 |
Bankrate: Mortgage Rates Nose Higher
|
pdf |
| 07/19/2016 |
54 Million Americans Prefer Cash as a Long-Term Investment
|
pdf |
| 07/14/2016 |
Bankrate: Mortgage Rates Rebound Slightly
|
pdf |
| 07/13/2016 |
Top Checking Account Sign-Up Bonuses Available Right Now
|
pdf |
| 07/07/2016 |
Bankrate: Mortgage Rates at 2nd-Lowest Level on Record
|
pdf |
| 07/06/2016 |
Only 1 in 3 Millennials are Investing in the Stock Market
|
pdf |
| 06/30/2016 |
Bankrate: Mortgage Rates Plunge to 3-Year Low Following Brexit Vote
|
pdf |
| 06/30/2016 |
New Cars Unaffordable in All Major U.S. Cities
|
pdf |
| 06/27/2016 |
Arlington, Va. is Best City to Retire
|
pdf |
| 06/23/2016 |
Bankrate: Mortgage Rates Rise Ahead of Brexit Vote
|
pdf |
| 06/21/2016 |
66 Million Have No Emergency Savings
|
pdf |
| 06/16/2016 |
Bankrate: Mortgage Rates Lowest in More Than 3 Years
|
pdf |
| 06/13/2016 |
Nearly 2 in 3 Millennials Do Not Have a Credit Card
|
pdf |
| 06/09/2016 |
Bankrate: Mortgage Rates Sink Lower
|
pdf |
| 06/02/2016 |
Bankrate: Mortgage Rates Drift Lower
|
pdf |
| 05/26/2016 |
Bankrate: Mortgage Rates Rise for Second Consecutive Week
|
pdf |
| 05/23/2016 |
Senior Citizens’ Incomes Fall Short in 47 of 50 States
|
pdf |
| 05/19/2016 |
Bankrate: Mortgage Rates Moving Higher
|
pdf |
| 05/17/2016 |
42 Million Americans Regret Not Saving Earlier for Retirement
|
pdf |
| 05/12/2016 |
Bankrate: Mortgage Rates Continue to Drop
|
pdf |
| 05/05/2016 |
Bankrate: Mortgage Rates Retreat for First Time in 3 Weeks
|
pdf |
| 05/02/2016 |
78% Have Successfully Asked for a Higher Credit Limit
|
pdf |
| 04/28/2016 |
Bankrate: Mortgage Rates Hit One-Month High
|
pdf |
| 04/25/2016 |
New York Named Best City for Launching a Career
|
pdf |
| 04/21/2016 |
Bankrate: Mortgage Rates Post First Increase in a Month
|
pdf |
| 04/19/2016 |
Financial Security Hits Lowest Point in 19 Months
|
pdf |
| 04/14/2016 |
Bankrate: Mortgage Rates Slide for 4th Week in a Row
|
pdf |
| 04/07/2016 |
Bankrate: Mortgage Rates at Lowest Level in Nearly Three Years
|
pdf |
| 04/05/2016 |
36 Million Homeowners Are Planning to Make Home Renovations This Year
|
pdf |
| 03/31/2016 |
Bankrate: Mortgage Rates Continue to Fall
|
pdf |
| 03/28/2016 |
Millennials Are the Best Savers
|
pdf |
| 03/24/2016 |
Bankrate: Mortgage Rates Slip Lower
|
pdf |
| 03/17/2016 |
Bankrate: Mortgage Rates Nudge Higher for 3rd Week in a Row
|
pdf |
| 03/14/2016 |
78% of Americans Willing to Delay Tax Refunds Due to Identity Theft Fears
|
pdf |
| 03/10/2016 |
Bankrate: Mortgage Rates Inch Higher
|
pdf |
| 03/08/2016 |
Credit Unions More Than Twice As Likely As Banks to Offer Free Checking Accounts
|
pdf |
| 03/03/2016 |
Bankrate: Mortgage Rates Show Slight Increase
|
pdf |
| 03/01/2016 |
Wyoming the Best State for Retirement, New York the Worst
|
pdf |
| 02/25/2016 |
Bankrate: Mortgage Rates at 2nd-Lowest Point of 2016
|
pdf |
| 02/23/2016 |
Only Half of Americans Have More Emergency Savings than Credit Card Debt
|
pdf |
| 02/18/2016 |
Bankrate: Mortgage Rates Post First Increase of 2016
|
pdf |
| 02/11/2016 |
Bankrate: Mortgage Rates At Lowest Since May 2013
|
pdf |
| 02/09/2016 |
Finances Are Preventing 45% of Non-Homeowners from Buying Homes
|
pdf |
| 02/04/2016 |
Bankrate: Mortgage Rates Fall For Fifth Consecutive Week
|
pdf |
| 01/28/2016 |
Bankrate: Mortgage Rates Fall to a 3-Month Low
|
pdf |
| 01/21/2016 |
Bankrate: Mortgage Rates Drop Below 4 Percent
|
pdf |
| 01/20/2016 |
41% of Americans Are Concerned About Rising Interest Rates in 2016
|
pdf |
| 01/14/2016 |
Bankrate: Mortgage Rates Continue to Pull Back
|
pdf |
| 01/07/2016 |
Bankrate: Mortgage Rates Start 2016 on the Downswing
|
pdf |
| 01/06/2016 |
63% of Americans Can’t Afford $500 Car Repair or $1,000 Emergency Room Visit
|
pdf |
| 12/31/2015 |
Bankrate: Mortgage Rates End the Year at 5-Month High
|
pdf |
| 12/23/2015 |
Bankrate: Mortgage Rates Tick Higher
|
pdf |
| 12/21/2015 |
Nearly Four in 10 Americans Haven’t Visited Bank Branch in Six Months
|
pdf |
| 12/17/2015 |
Bankrate: Mortgage Rates Nosed Higher Leading Up to Fed Hike
|
pdf |
| 12/15/2015 |
Just 22% of U.S. Workers Expect a Holiday Bonus
|
pdf |
| 12/10/2015 |
Bankrate: Mortgage Rates Tick Higher
|
pdf |
| 12/07/2015 |
CD Early Withdrawal Penalties Bite into Principal at 89% of Financial Institutions
|
pdf |
| 12/03/2015 |
Bankrate: Mortgage Rates Slide for Third Consecutive Week
|
pdf |
| 11/25/2015 |
Bankrate: Mortgage Rates Continue to Decline
|
pdf |
| 11/23/2015 |
Americans Prefer Cash While Holiday Shopping
|
pdf |
| 11/19/2015 |
Bankrate: Mortgage Rates Slip Amid Global Terror Concerns
|
pdf |
| 11/17/2015 |
More Than 1 in 3 Americans Claim Their Top Financial Priority is Managing Bills
|
pdf |
| 11/12/2015 |
Bankrate: Mortgage Rates Are on the Rise
|
pdf |
| 11/09/2015 |
Gift Cards a Consumer Friendly Choice This Holiday Season
|
pdf |
| 11/05/2015 |
Bankrate: Mortgage Rates Jump on Talk of December Rate Hike
|
pdf |
| 10/29/2015 |
Bankrate: Mortgage Rates Slip Further; Jumbo Rates at Record Low
|
pdf |
| 10/26/2015 |
Houston, TX Named Best City for Building Wealth
|
pdf |
| 10/22/2015 |
Bankrate: Mortgage Rates Show Little Change
|
pdf |
| 10/19/2015 |
American Consumer Horror Story: 77% of Americans Frightened of Identity Theft
|
pdf |
| 10/15/2015 |
Bankrate: Mortgage Rates at Nearly 6-Month Low
|
pdf |
| 10/13/2015 |
62% Holding Back Spending
|
pdf |
| 10/08/2015 |
Bankrate: Mortgage Rates Dip Below 4 Percent
|
pdf |
| 10/05/2015 |
ATM, Overdraft Fees Hit New Record Highs
|
pdf |
| 10/01/2015 |
Bankrate: Mortgage Rates Show Little Change
|
pdf |
| 09/24/2015 |
Bankrate: Mortgage Rates Fall to 4-Month Low
|
pdf |
| 09/23/2015 |
30 Million Americans Used Retirement Savings for an Emergency Over Past Year
|
pdf |
| 09/17/2015 |
Bankrate: Mortgage Rates Nose Higher
|
pdf |
| 09/14/2015 |
Bankrate Inc. names Scott Kim as CEO of its Banking Segment, Bankrate.com
|
pdf |
| 09/10/2015 |
Bankrate: Mortgage Rates Hold Steady
|
pdf |
| 09/09/2015 |
Credit Score Misconceptions Revealed
|
pdf |
| 09/03/2015 |
Bankrate: Mortgage Rates Nose Higher
|
pdf |