


Mortgages
Compare mortgage rates locally, evaluate lenders, and utilize our calculators to determine affordable home prices. Access expert guidance and updates.
Explore more
Mortgage basics

How to get the best mortgage rate
Mortgages
Shopping around for the best rate possible is more important than ever.

First-time homebuyer guide
Mortgages
Being a novice often feels like a nuisance. However, there are actually perks to being a first-timer.

5 types of mortgage loans for homebuyers
Mortgages
A comprehensive list to help you find the right financing tool for your dream home.
Reviews & tools
Limited spots available
Help us shape the future of personal finance
We’re building something new to make rate shopping smarter and simpler. Join our waitlist to get early access, share your feedback, and unlock exclusive offers.
Priority rate alerts
Exclusive member offers
Time saving
Please provide a valid email address
Limited spots remaining
You're signed up!
Now, help us personalize your experience. Answering the next few questions will ensure you receive the most relevant tips and offers.
Stay tuned to see what we're building
You're all set! We're gearing up to share something big. You'll hear from us soon with what's next.
Explore our series


- The Mortgage Process
- Guide to Comparing Mortgage Lenders
- Applying for a Mortgage
A primer on how these home loans work, including the lingo you need to know.
Follow these 10 steps to nail the loan and make buying that home a reality.
A comprehensive list to help you find the right financing tool for your dream home.
Shopping around for the best rate possible is more important than ever.
Not all lenders are alike. Here’s how to distinguish them, and why it matters for your mortgage.
Getting the right mortgage starts with choosing the right lender.
Shopping around for a mortgage can make a big difference in the amount you pay.
Here are the best mortgage lenders for June 2026.
By comparing mortgage offers, you can potentially save thousands.
Think of it as mortgage preapproval lite. Easier to get, but less useful too.
They sound similar, but only one assures home sellers you’re a serious buyer.
If you’re serious about buying a home, it’s the first thing you should do.
It’s a mouthful that actually has a simple meaning: the creation of your loan.
A mortgage application includes everything the lender needs to know to approve or deny your loan.
What to expect from start to finish when lenders evaluate you for a home loan.
The trusted provider of accurate rates and financial information
Bankrate's featured news highlights


The latest

Selling a house isn’t free — here’s a breakdown of common closing costs for sellers.

Mortgage rates retreated a bit this week but remain above 6.5%.

Is one better than the other? Here are the pros and cons of each.

It varies, but generally, the lower the better. Here’s why.

Hard to avoid it if your down payment is low. But must you pay this extra fee forever?

FHA loans can help borrowers with less-than-ideal credit and cash. But they aren’t perfect.

Lenders use this guideline to determine how big of a home purchase you can afford.

If you get a mortgage, you’ll need to make a monthly loan payment. Here’s a look at the national average.

Underwater mortgages can occur during an economic downturn when home values fall.

Here are the best mortgage lenders for June 2026.

Bottom line: Will refinancing help you save money?

Here’s how to refinance a car loan and save.

Whether you can refinance your car loan with poor credit and save depends on several factors, including your current loan.

It takes a bit of strategy. Here’s what you need to know, in seven handy tips.

The Federal Reserve’s decisions have ripple effects, including for mortgages.

Here are some of the best mortgage lenders in Florida in 2026.
Here are the best mortgage lenders for June 2026.
Here are some of the best mortgage lenders in Florida in 2026.

Here are some of the best mortgage lenders in California in 2025.

Here are some of the best mortgage lenders in Texas in 2026.

Our list of lenders best suited to helping out a novice homeowner-to-be.
When it comes to these easier-to-qualify-for loans, these lenders are tops.
Here are some of the best cash-out refinance lenders in 2026.

Here is Bankrate’s guide to the best construction loan lenders.
Underwater mortgages can occur during an economic downturn when home values fall.

For much of the U.S., the divide between conforming loans and jumbo mortgages will be $832,750.

Don’t give up on trying to keep your home. One of these strategies might rescue you.
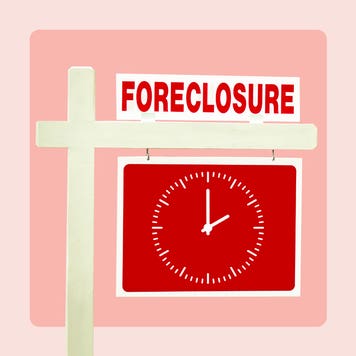
It’s not the end if you miss just one. But don’t make a habit of it.

Is a Fannie Mae HomePath property right for you?

It’s like a mortgage, only it makes foreclosure a lot easier.

If you’re behind on your mortgage, a Flex Modification might be able to help.

A notice of default is the first legal step in foreclosure. If left unaddressed, you could lose your home.