Homeowner data and statistics 2023

The Bankrate promise
At Bankrate we strive to help you make smarter financial decisions. While we adhere to strict , this post may contain references to products from our partners. Here's an explanation for .
Amid dogged inflation, as Americans grapple with the steep cost of, well, everything, homeownership has become an elusive goal to achieve. It peaked in 2005 when well over two-thirds of American housing units were “owner-occupied” (as U.S. Census Bureau lingo puts it). This homeownership rate then began to sink, down to 63.1 percent in 2020 — its lowest level in five decades. It has budged only slightly since then.
It’s not hard to see why. Between the first quarter of 2021 and the first quarter of 2022, housing prices increased 18.7 percent, according to the Federal Housing Finance Agency Price Index. While the appreciation pace has slowed somewhat — prices climbed 4.3 percent between Q1 2022 and Q2 2023 — it’s still headed upward. In fact, at $410,200 (as of June 2023), the median existing-home sales price is the second-highest price ever recorded since January 1999, when the National Association of Realtors (NAR) began tracking the data.
Rising mortgage interest rates haven’t helped either, jumping from around 3 percent during the pandemic to around 7 percent currently. Homebuyers on a $3,000 monthly mortgage payment budget have lost $30,000 in purchasing power since February 2023 alone. In other words, they can afford to purchase a $450,000 home in July, compared to one priced at $480,000 five months ago, and a $510,000 one a year ago.
Given such market realities, it’s small wonder that 73 percent of aspiring homeowners cite affordability as their primary obstacle to their aspiration, a March Bankrate survey found. And 1 in 4 Americans (25 percent) say the lack of housing affordability and having to rent (rather than own) makes them feel financially insecure, according to Bankrate’s recent Financial Freedom survey.
Like many other aspects of the U.S. economy, however, the housing market constantly fluctuates, based on buyer demand, mortgage interest rates, inflation, amount of available inventory, and other dynamics. Let’s look at the key facts and statistics to better inform current and future homeowners.
Key homeowner data 2023
- The homeownership rate in the U.S. as of the first quarter of 2023 is 66%.
- The number of U. S. households increased by just 10.1 million from 2010 to 2020, fewer than in any other decade between 1950 and 2010.
- The homeownership rate among young adults (25-to-34-year-olds) has declined from 45% in 1990 to 41.6% as of 2021.
- The number of first-time homebuyers declined to just 26% in 2022, which is the lowest level since the National Association of Realtors began tracking data. That figure also represents a significant drop from 34% one year earlier.
- The typical recently purchased home is 1,800 square feet with three bedrooms and two bathrooms, and dates from 1986.
- 22% of recent homebuyers are veterans and 1% are active-duty service members.
- A majority of buyers purchased their homes for 100% of the asking price, while 28% purchased for more than the asking price.
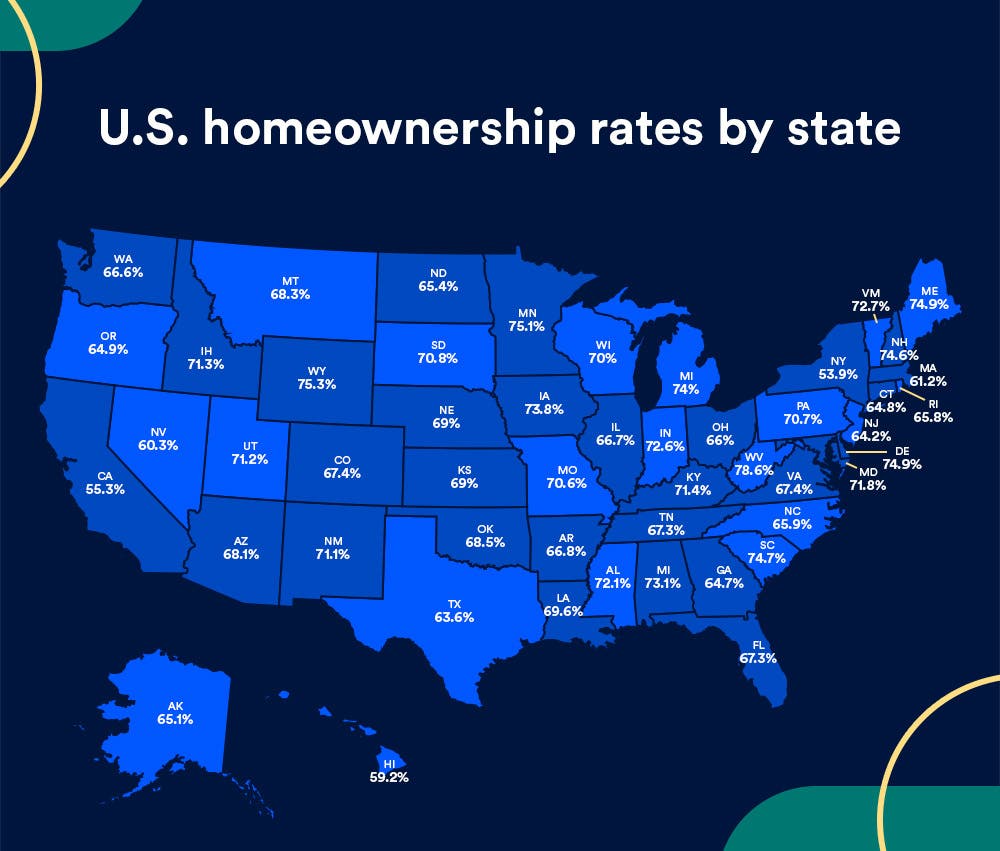
U.S. homeownership rates by state
The map below showcases homeownership rates by percentage for each state, based on the latest data from the U.S. Census Bureau.
Quarterly homeownership rates by population percentage
Typically, there is incremental movement in homeownership statistics over time. However, homeownership rates are subject to volatility during major economic events. For example, after peaking at 69 percent in 2004, the Great Recession (2007-09) led to homeownership rates declining, falling to just 63.4 percent by 2016. As homeownership began to slowly recover, the rate peaked again at 67.9 percent in the second quarter of 2020 before falling to 65.5 percent at the end of 2021, most likely due to the pandemic. Throughout 2022, the homeownership rate has remained within the same statistical range. As of the first quarter of 2023, the rate of U. S. homeownership is at 66 percent.
The table below showcases the quarterly homeownership rate for the past three years.
| Year | First quarter rate | Second quarter rate | Third quarter rate | Fourth quarter rate |
|---|---|---|---|---|
| SOURCE: U.S. Census Bureau, Current Population Survey/Housing Vacancy Survey, March 15, 2023 | ||||
| 2022 | 65.4% | 65.8% | 66% | 65.9% |
| 2021 | 65.6% | 65.4% | 65.4% | 65.5% |
| 2020 | 65.3% | 67.9% | 67.4% | 65.8% |
Insights
- The homeownership rate in the U.S. was at 65.9% during the fourth quarter of 2022 and was not statistically different from the fourth quarter of 2021 (65.5%) or the third quarter of 2021 (65.4%).
- National vacancy rates in the first quarter of 2023 were 6.4% for rental housing and 0.8% for homeowner housing.
- The national rental vacancy rate during the first quarter of 2023 was higher than during the first quarter of 2022 (5.8%) and higher than in the fourth quarter of 2022 (5.8%).
The 10 states with the highest homeownership rates
Below are the top 10 states, ranked by the percentage of their populations who are homeowners, as of year-end 2022.
| West Virginia | 78.6% |
|---|---|
| Wyoming | 75.3% |
| Minnesota | 75.1% |
| Delaware | 74.9% |
| Maine | 74.9% |
| South Carolina | 74.7% |
| New Hampshire | 74.6% |
| Michigan | 74% |
| Iowa | 73.8% |
| Mississippi | 73.1% |
The 10 states with the lowest homeownership rates
Below are the bottom 10 states, ranked by the percentage of their populations who are homeowners, as of year-end 2022.
| Connecticut | 64.8% |
|---|---|
| Georgia | 64.7% |
| New Jersey | 64.2% |
| Texas | 63.6% |
| Massachusetts | 61.2% |
| Nevada | 60.3% |
| Hawaii | 59.2% |
| California | 55.3% |
| New York | 53.9% |
| District of Columbia | 42.3% |
Average age of homeowners
A home purchase continues to be one of the largest investments many Americans will make in their lifetime. The graph below showcases homeownership statistics by age, highlighting that for many people, the homeownership journey begins before age 35 and expands over time, with the largest group of homeowners being over age 65.
Insights
- The typical first-time homebuyer was 36 years old in 2022, according to NAR, while the typical repeat-buyer age rose to a record high of 59 years old.
- 14% of homebuyers purchased a multi-generational home with considerations for caring for aging parents, young adult children moving back home and cost-saving.
- Fourth quarter 2022 homeownership rates were highest for homeowners aged 65 years and over (79.%) and lowest for homeowners under 35 years of age (38.7%).
- 56% of millennial homeowners have some regrets about purchasing their homes, with maintenance and hidden costs being the biggest culprits.
- 24% of Gen Z and 11% of millennials say they are living rent-free, meaning they live with their parents or other friends and family.
Homeowner rates by race and ethnicity
Homeownership statistics by race show that White households have the highest rates of homeownership. The homeownership rate for Asian homeowners is the second highest at 61 percent followed by Hispanic homeowners at more than 48 percent, according to 2022 Census data. For Black homeowners, the rate remains lower at just 45 percent.
Insights
- According to the Population Reference Bureau, White householders have historically had the highest rates of homeownership.
- According to the NAR, minority groups still face a gap in homeownership rates compared to their White counterparts in 2022.
- The 2022 homeownership rate for Black Americans is 45%, which is significantly less than White Americans at nearly 75%.
- NAR reports Asian and Hispanic Americans are experiencing the highest homeownership rates in a decade.
Homeowner rates by gender
Despite often having a lower household income, women consistently make up the second largest group of homeowners, behind married couples — and have done ever since the National Association of Realtors (NAR) started keeping track in 1981.
When the NAR first began collecting data 43 years ago, 73 percent of home buyers were married couples and 11 percent were single women, while 10% were single men. Fast forward to 2022 and single women continue to be a force to be reckoned with: 61 percent of home buyers are married couples and 17% are single women, while 9 percent are single men. Single women homebuyers hit a peak in 2006, when they accounted for 22 percent of those making purchases.
While women continue to buy homes in significant numbers they often face financial challenges or stress. The realities of the continued gender wage gap mean that women typically come to the table with a smaller down payment than their male counterparts, which requires taking out a larger mortgage. This in turn results in women starting out with less equity in their homes than men.
Related Articles