Average cost of commuting in 2023

The Bankrate promise
At Bankrate we strive to help you make smarter financial decisions. While we adhere to strict , this post may contain references to products from our partners. Here's an explanation for . The content on this page is accurate as of the posting date; however, some of the offers mentioned may have expired. Terms apply to the offers listed on this page. Any opinions, analyses, reviews or recommendations expressed in this article are those of the author’s alone, and have not been reviewed, approved or otherwise endorsed by any card issuer.
When it comes to working, getting to the office is half the battle. And there’s no greater temptation to hit snooze than when you think about the journey ahead of you. While more companies have adapted to the remote work model that has grown in popularity since March 2020, many workers are still traveling to and from an office every day.
Some people face crowded subways while others hit the highway, but there’s one pain point that most workers share: commuting expenses.
Here’s a look at what Americans are spending in time and money on their daily commute.
- Average commute expenses in the U.S.: $8,466 [1]
- Average U.S. commute by total time: 239 hours [1]
- Best city for commuters: Buffalo, New York [1]
- Worst city for commuters: Detroit [1]
- Percentage of full-time employees who commuted to work at least part-time in February 2023: 88.4 percent [2]
- Most popular mode of transportation for commuters: car [3]
- Most common alternative to cars as a mode of commuting: public transportation [3]
Modes of transportation
The true cost of commuting looks different for every American worker. Unless you’re fortunate enough to have a short commute from your bedroom to your home office, your commute may involve a little more time and money.
Here’s a snapshot of what getting to work looks like for American commuters.
- Percentage of people who commute by personal vehicle: 76% [3]
- Percentage of people who commute by public transportation: 11% [3]
- Percentage of people who commute by rideshare: 7% [3]
- Percentage of people who commute by taxis: 5% [3]
- Percentage of people who commute by car sharing: 5% [3]
- Percentage of people who commute by bike: 10% [3]
Average amount of time spent commuting
Commuting can definitely put a strain on your wallet, but it can also eat up your time. Waking up early enough to get ready and commute to work can take up a tremendous amount of time, and that doesn’t account for potential hiccups like especially bad traffic, a delayed train or bad weather.
According to a recent survey by Clever Real Estate, workers spend an average of 239 hours commuting each year, and the average American worker loses an additional 32 hours to traffic each year.
How commuting has changed
Commuting has changed significantly in recent decades as public transportation systems have evolved and new work models have been adopted to keep up with changing times. Over the past decade, an increased understanding of how commuting has impacted the climate crisis has also led many workers to consider greener modes of transportation for their daily commute.
In more recent years, many workers cut their commute out of their daily schedules altogether as more companies have begun allowing their employees to work from the comfort of their homes. In fact, studies show that these travel restrictions drastically decreased air pollution and greenhouse gas emissions within just a few weeks. [9]
While many workers have shifted to a remote or hybrid work model, cars and public transportation are expected to remain the most common forms of commuting to work.
Average cost of commuting
Those who drive to work will need to make sure they’re factoring all of their commuting costs into their monthly budget. According to Clever Real Estate, commuters in the U.S. spend approximately $8,466 on their commute every year — about 19 percent of their annual income. [1] The same report showed that commuters spend an average of $867 on fuel per year and an additional $410 on vehicle maintenance. Additional costs could also include parking pass fees, tolls and parking tickets.
Average gas prices
The cost of gas plays a huge role in how much commuters are shelling out to get to work and back each day. Although the average national cost of a gallon of gas hit $5 for the first time in June 2022 [10], it has since fallen to an average of $3.71 in May 2023. [13]
Yet despite this decrease, many commuters are still feeling pain at the pump as the cost of other goods and services has increased as well. To combat these costs, many employers have decided to take matters into their own hands, providing their employees with stipends, gas gift cards or a flexible work model to retain employees. For those who aren’t so lucky, a price tracker application like GasBuddy is another way to trim fuel expenses.
Average car maintenance costs
Owning a vehicle comes with the financial responsibility of maintenance. Oil changes and tires range in cost, but a report by AAA found that drivers who drive an average of 15,000 miles per year put an average of $9,666 toward their cars. This data was collected in 2021 and reflected a $279 increase from the previous year. [11]
Here’s a snapshot of how much it costs to own and maintain a vehicle according to an analysis from Bankrate [12]:
- The average cost to operate a new car in 2021 was $9,666.
- The average driver spends $1,771 per year for full coverage car insurance.
- License, registration and vehicle taxes cost $699 per year.
- Drivers of newer vehicles should get their oil changed every 5,000 to 7,500 miles.
- 1 in 3 drivers can’t afford unexpected vehicle repairs.
- 9 percent of drivers have delayed their vehicle’s routine maintenance.
Best and worst cities for commuters
Your commute will look a little different depending on where you live. However, there are a few cities where the time and money spent on your commute is a bit more manageable. Here’s a look at the top five best and worst cities for commuters.
| Rank | City | Annual hours lost to traffic | Annual fuel costs | Time to work (minutes) | Annual cost of commute |
|---|---|---|---|---|---|
| 1 | Buffalo, NY | 6 | $641 | 22 | $6,427 |
| 2 | Salt Lake City, UT | 10 | $648 | 23 | $6,518 |
| 3 | Milwaukee, WI | 22 | $667 | 23 | $6,777 |
| 4 | Virginia Beach, VA | 9 | $714 | 25 | $6,367 |
| 5 | Cleveland, OH | 15 | $728 | 25 | $6,745 |
| Rank | City | Annual hours lost to traffic | Annual fuel costs | Time to work (minutes) | Annual cost of commute |
|---|---|---|---|---|---|
| 50 | Detroit, MI | 13 | $989 | 27 | $12,801 |
| 49 | Atlanta, GA | 53 | $1,180 | 32 | $9,350 |
| 48 | New York, NY | 102 | $764 | 37 | $12,148 |
| 47 | Riverside, CA | 32 | $1,225 | 33 | $9,078 |
| 46 | Los Angeles, CA | 62 | $1,211 | 31 | $10,101 |
How to save money on your commute
Commuting can become pricey over time. Luckily, there are several ways to trim your commuting costs.
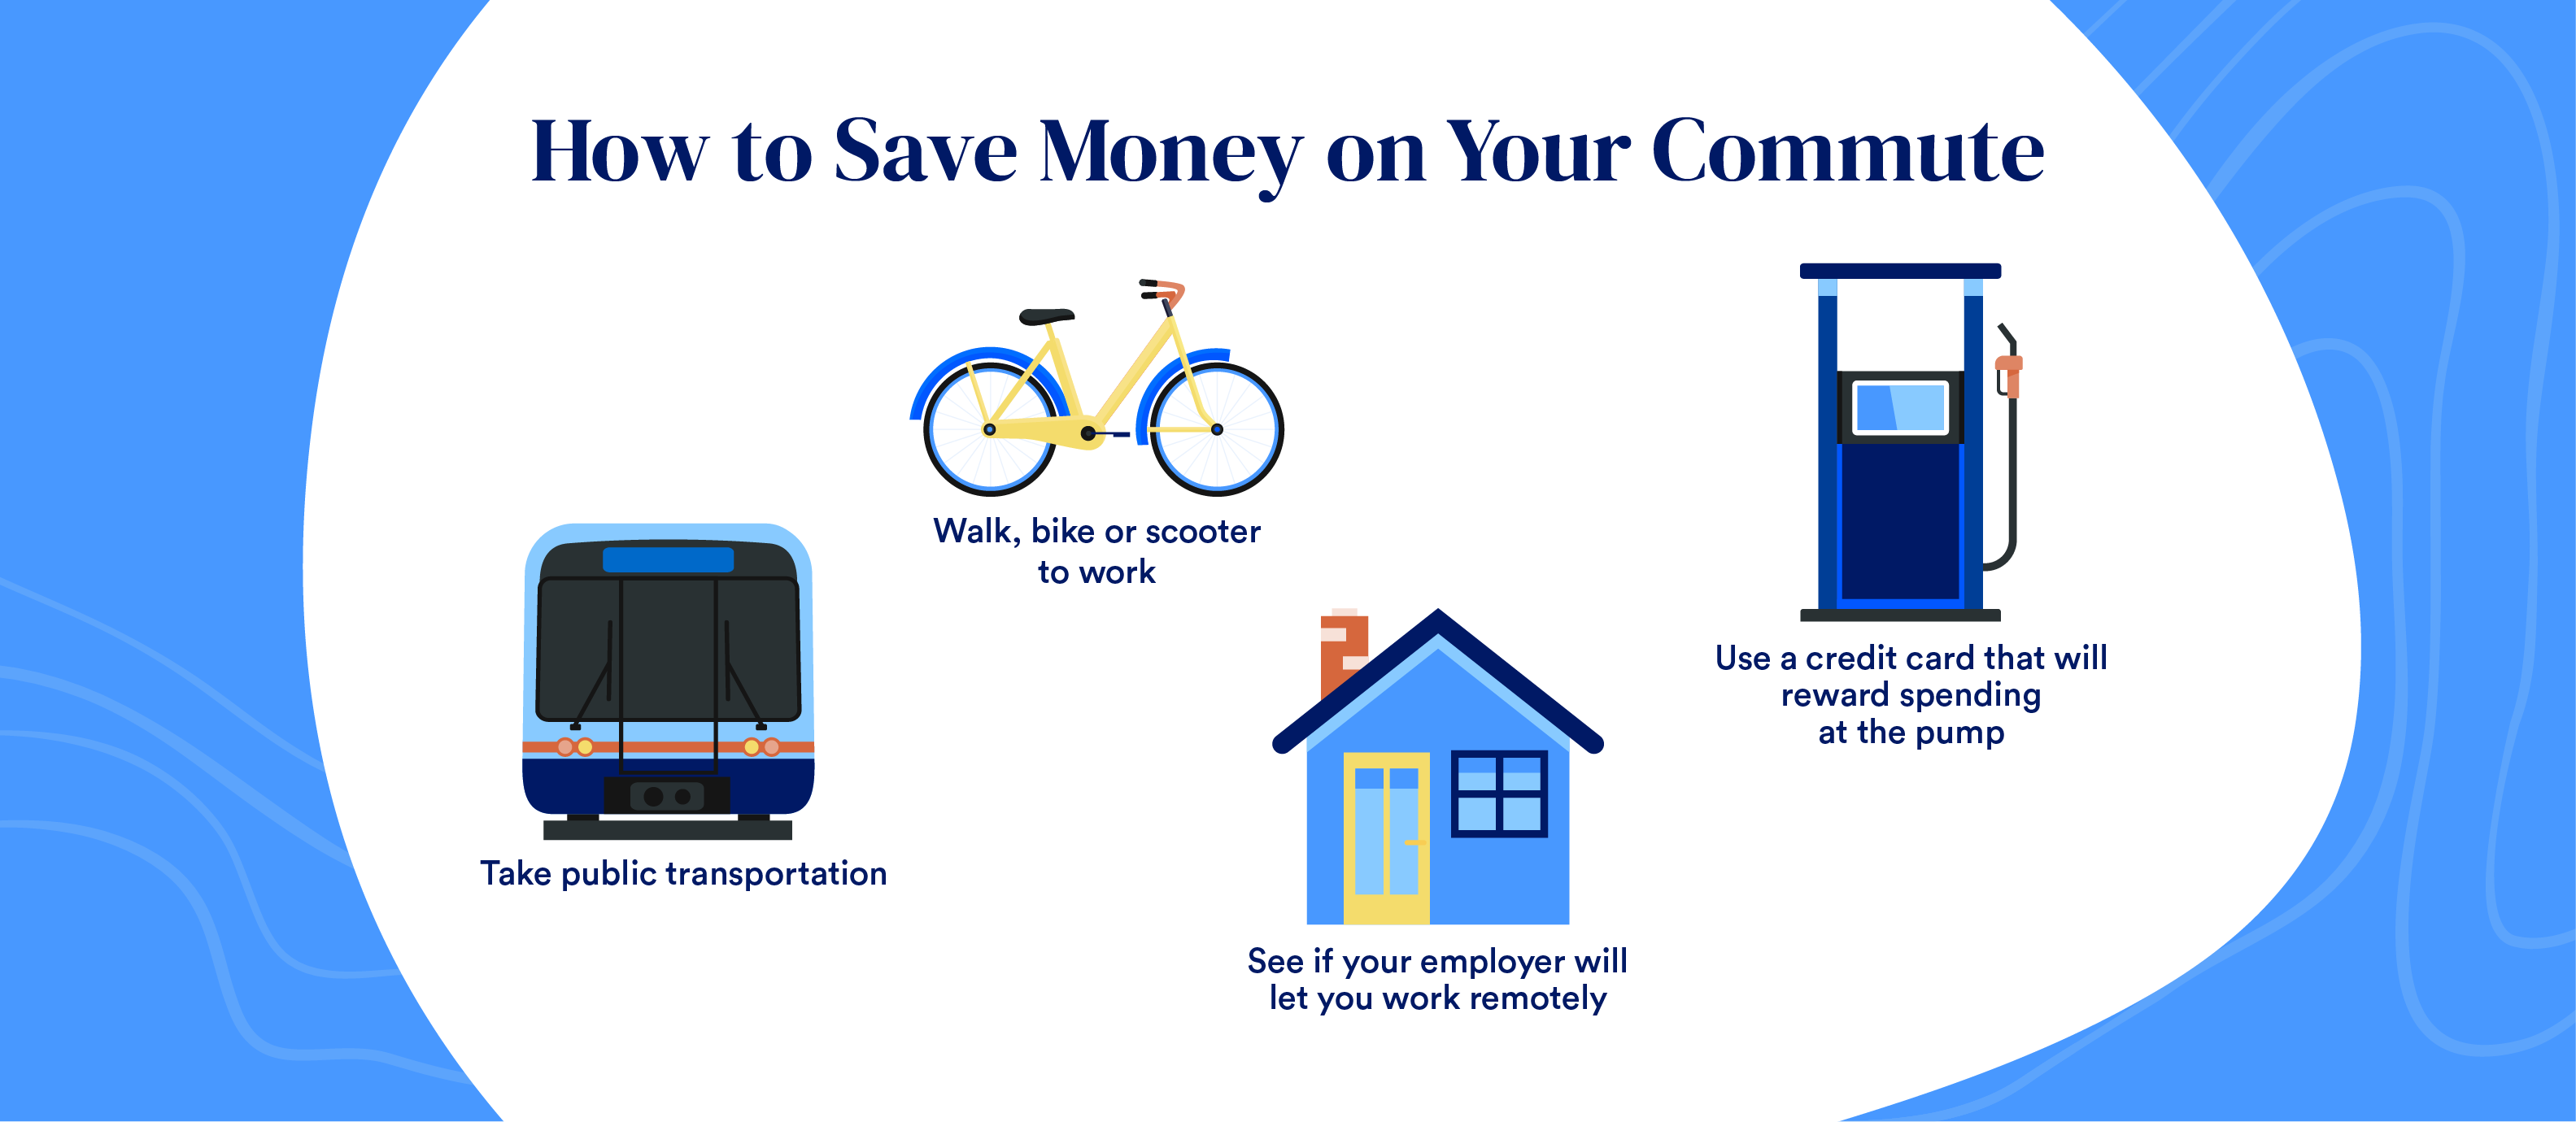
- Take public transportation: A bus or train pass will likely cost you less than a monthly car and insurance payment. It’ll also save you money on parking passes and time spent looking for parking. See if it makes sense to commute to work by public transport to save a little extra each month.
- Walk, bike or scooter to work: Not only is it better for your wallet, but you’ll also be doing the environment a solid as well. It could also be a way of getting your daily exercise into your schedule at no extra cost.
- See if your employer will let you work remotely: If filling up your tank is taking a toll on your checking account, see if your employer is willing to let you work remotely for a few days each week. Even if they won’t agree to a fully remote situation, working from home even one or two days per week could save you money.
- Use a credit card that will reward spending at the pump: If you’re going to spend the money anyway, see if you can apply for a credit card that will reward you with cash back for your fuel purchases. Here’s a list of some of the best gas credit cards this year.
The bottom line
Getting to and from work daily is an added expense for many workers across the U.S. But even so, it doesn’t have to drain your wallet. Your location, mode of transportation and employer play a huge role in how much you can expect to pay for your daily commute. By calculating how much you’re spending and using our tips to save, you can put your extra funds toward a more meaningful purchase or investment.
Sources
[1] The Best and Worst Cities for Commuters in 2022, Clever Real Estate
[2] Survey of Working Arrangements and Attitudes (SWAA), May 2023 Update, WFH Research
[3] Cars still dominate the American commute, Statista
[4] The Great Divide in How Americans Commute to Work, Bloomberg
[5] Younger Workers in Cities More Likely to Bike to Work, U.S. Census Bureau
[6] Car accidents by state, PolicyGenius
[7] Riskiest roads in the U.S., USA Today
[8] 50% of companies want workers back in office 5 days a week, CNBC
[9] Emission Reductions From Pandemic Had Unexpected Effects on Atmosphere, NASA
[10] Average US gas price hits $5 for first time, CNN
[11] How Much Does it Really Cost to Own a New Car?, AAA
[12]Average car maintenance costs, Bankrate
[13]US Retail Gas Price, YCharts
Related Articles